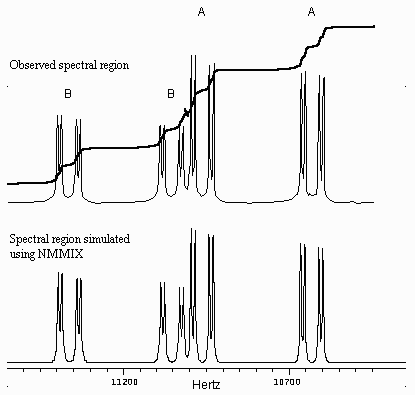
Besides specifying the relative integrals, the user sets the peak widths for each compound in the region to be plotted. Doing this interactively, after the NUMARIT calculations have been done, is particularly convenient. NMMIX allows each region of the spectrum to be selected in turn, and for each the plotted height of the tallest peak in the mixed spectrum is scaled to a value input by the user, allowing observed spectra to be matched accurately.
This illustration shows a region of the 31P NMR spectrum
of a mixture of two diastereomers A and B. The integral on the experimental
spectrum shows that their concentrations were similar (A : B = 54.8 : 45.2)
but the peak heights for B were only about half those for A. This
was because at room temperature the peaks of this multiplet of each compound
showed broadening because of hindered rotation of substituents, and, because
of different separation of chemical shifts in the exchanging rotamers of
the two diastereomers, B had broader peaks than A. Using the published
peak widths (A 4.5, B 5.7 Hz) in NMMIX gives a simulation very similar
to the observed spectrum.
(Bruce W. Tattershall, Julian G. Knight, Mark J. Andrews and Claire
L. Booth
Z. Anorg. Allg. Chem. 2006, 632, 425-432)