ACE 2006:  World Food 'Crisis' - 2008


In late 2007 world food prices rose substantially, and continued to rise during early 2008, prompting widespread comment about a 'crisis' and of Malthusian predictions finally beginning to come true (Question - do you know what the Malthusian predicitions are and why? If not, look them up!). 

QUESTIONs:  what caused the spike in commodity prices?  will the spike persist to become a new phase or era of commodity prices? so what, for farming?

Synopsis:  An F has been added to the demand factors facing farming:  Food,  Feed, Fibre, and now Fuel, while world economic growth rates, combined with continued population growth, seem likely to sustain demand growth in the future to at least keep pace with if not exceed world supply capacity, severely limited by the availability of additional land, and especially, water. Meanwhile, short-term prices will continue to respond to and reflect current harvest conditions and stock levels, while short-term conditions of supply and demand (both tending to be inelastic in short run) mean that any variations in excess demand will generate substantial short run price volatility, despite the fact that theWTO URAA and (potentially) a Doha agreement tend to reduce world price volatility.

The Situation:
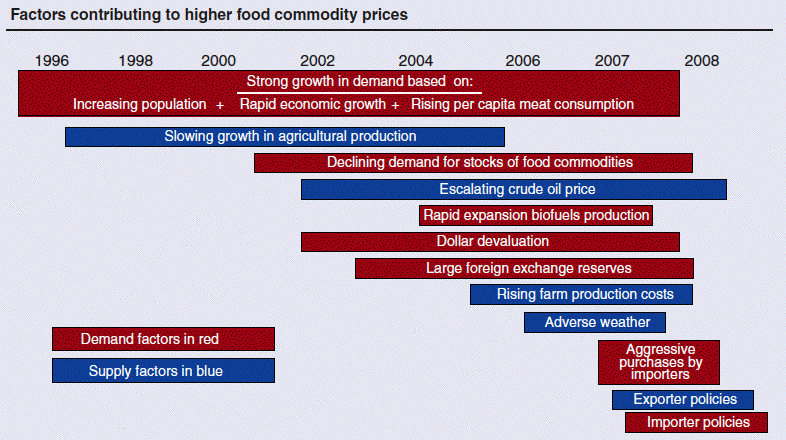
  Taken From Keith Collins: The Role of Biofuels and Other Factors in Increasing Farm and Food Prices.  A Review of Recent Developments with a Focus on Feed Grain Markets and Market Prospects, June 2008)

For a more recent analysis of the food price spike(s), see the FAO's Committee on World Food Security - High Level Panel of Experts (CFS/HLPE):  Price Volatility and Food Security, July, 2011

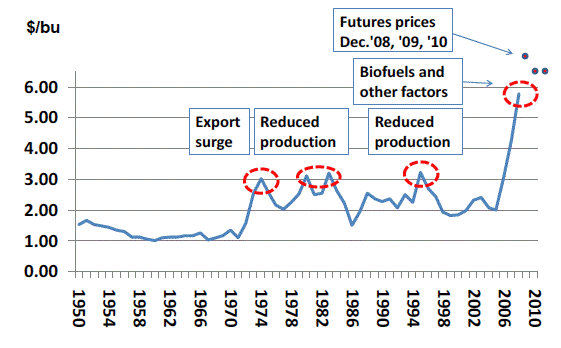
US Corn: Average Farm Price:
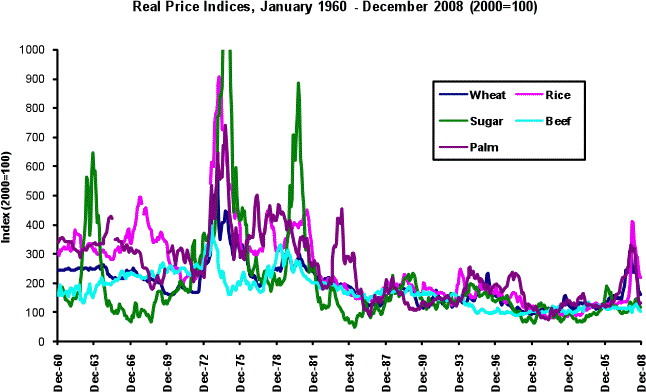
(Note, however, that the current spike (2007/8) is actually lower in real terms than the first post war spike of 1973/4, see, e.g., European Commission: "High prices on agricultural commodity markets: situation and prospects", (07/2008), Figure 1, and text, p6)

Real Prices 1960 - 2008

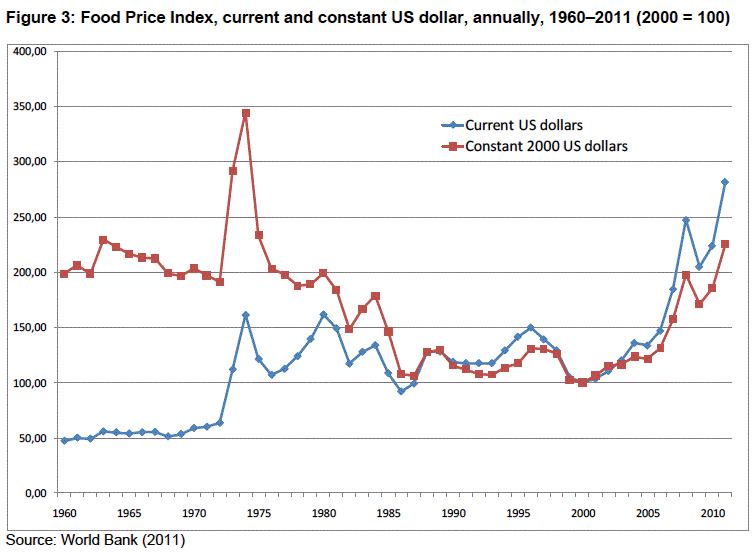
HLPE Figure 3(from CFS: HLPE (op cit., 2011) p. 21)


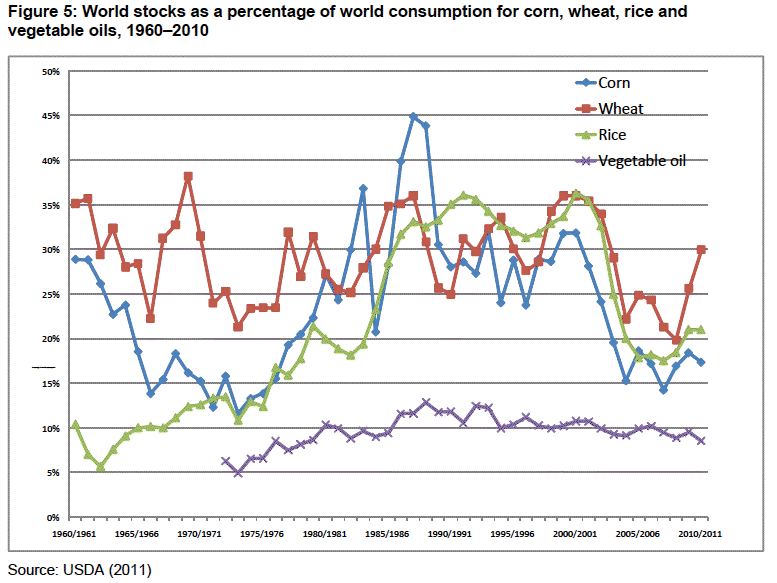
HLPEFig5
from CFS: HLPE (op cit., 2011) p. 28)


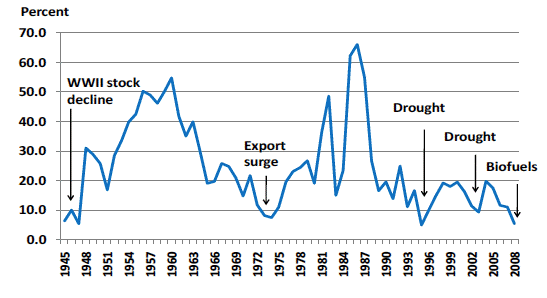
US Corn: Stocks to Use Ratio. (The lower are stocks, the greater the impact of current harvest shortfalls or surges in demand on current prices, since the low stocks are not able to buffer excess demand surges - not that the previous troughs in stocks/use ratios have also corresponded to price spikes)


The USDA, ERS report [Trostle, R. “Global Agricultural Supply and Demand: Factors Contributing to the Recent Increase in Food Commodity Prices.” Outlook Report No. WRS-0801, Economic Research Service, U.S. Department of Agriculture, May 2008., p6]


"A number of factors have contributed to the tight market conditions that set the stage for the sharp increase in food commodity prices since 2002. Some factors reflect underlying trends in supply and demand for agricultural commodities that began more than a decade ago. Trends of more rapid expansion in demand and slower growth in production began in the 1990s, and contributed to declining global demand for stocks of grains and oilseeds since 2000. Then, rising crude oil prices and changing biofuel policies provided incentives to expand biofuel production in some countries. Also, since the early 2000s, the declining value of the dollar and the foreign accumulation of foreign exchange reserves (U.S. dollars) enabled some countries to increase food commodity imports, even as world prices denominated in dollars reached record highs. On the supply side, largely due to rising energy prices, production costs for most of the world’s farmers were increasing and, in 2006 and 2007 adverse weather in a number of countries reduced global production of grains and oilseeds.
Together, these factors resulted in declining global stock-to-use ratios for aggregate grains and oilseeds which, by 2007, fell to the lowest levels since 1970. Importers faced declining market supplies and many countries experienced politically sensitive increases in domestic food prices, leading some to contract aggressively for future imports, even at world record prices. Finally, in late 2007 and early 2008, various exporters of food commodities imposed restrictions on exports in an attempt to moderate domestic food price infl ation. These actions, combined with the already tight market conditions, set the stage for the further rapid increases in food prices in late 2007 and early 2008."

In relation to this picture - especially "slowing growth in ag. production - the European Commission (op. cit. p. 30) notes "Global lack of investment in research and development might hinder the capacity to keep pace with demand growth. In the 1980s the Green Revolution spending reduced. Spending on farming as a share of total public spending decreased by half between 1980 and 2004. Private research, despite its importance, has not deemed to be sufficient in replacing the role of public research, especially in poor countries. Lack of investment in rice during the periods of low prices in the 1990s is a prime example. Directly related are questions of technological progress, related to yield stagnation, seed improvement, rise in production costs and the declining profitability of the agricultural sector. This difficulty may also be associated with more constraining environmental legislation in some countries, at least in the EU. Seed improvement is a promising source of improvement but usually around 10 – 15 years is needed between the introduction and commercialisation of seed varieties (International Rice Research Institute estimate)."

See CFS/HLPE (above) for an alternative view - though pretty much in agreement with the above:

In September, 2008, a Press Release from the University of Illinois said:

"An ethanol-fueled spike in grain prices will likely hold, yielding the first sustained increase for corn, wheat and soybean prices in more than three decades, according to new research by two University of Illinois farm economists.  Corn, an ethanol ingredient that has driven the recent price surge, could average $4.60 a bushel in Illinois, nearly double the average $2.42 a bushel from 1973 to 2006, said Darrel Good and Scott Irwin, professors of agriculture and consumer economics. They say price swings stemming from weather or other market variables could send corn as high as $6.70 a bushel or down to $3, based on a review of market data dating back to the mid-1900s for a report titled "The New Era of Corn, Soybean and Wheat Prices."

"The extreme low prices in terms of the new era would have been considered awfully good prices in the old era," Good said. Soybean prices could average $11.50 a bushel, up sharply from an average of $6.15 from 1973 to 2006, with swings from $8.20 to $19 a bushel. Wheat could increase to an average $5.80 a bushel, up from $3.24, dipping as low as $3.30 a bushel or as high as $10.15. Although the forecasts are based on Illinois grain prices, Good says increases will likely be similar on a percentage basis in other grain-producing states.  Irwin says the study stemmed from concerns as farmers tried to get a handle on rising prices when markets turned volatile in the wake of the ethanol boom.  "There was frustration that they no longer had a frame of reference," Irwin said. "This is our first effort to try to provide some perspective on what might be high and what might be low, with all of the caveats about how difficult that is to do."

Research revealed just two earlier lasting increases in grain prices. The first came after World War II, when price controls were lifted and post-war rebuilding began. The second lasting increase began in 1973, sparked by shifts in exchange-rate policies, massive grain purchases by the former Soviet Union and a period of escalating energy prices and more rapid inflation. Good says the dawn of the new era mirrors the earlier ones, driven by the growth of ethanol and accompanied by higher inflation and production costs that have been permanently inflated.

The study forecast average prices for the new era based on increases between the World War II and post-1973 eras, which ranged from 79 percent for wheat to 134 percent for soybeans. It also accounts for fluctuations as the new higher prices take hold, setting a range of possible highs and lows based on data from the first five years of the earlier eras. Irwin says the new price era could easily last two or three decades, sustained by corn prices that are now tethered to near-record gasoline prices because of ethanol. "The key is what happens in our crude oil and energy markets," he said. "The risk on the downside is technological breakthroughs that would dramatically reduce oil consumption, lowering the whole price structure. If anything, though, the risk is on the other side. We likely are going to continually be bumping into demand for crude-oil production that we can't easily get above."

Good says new era prices would not be affected by a shift from ethanol to another fuel additive made from crops, such as switchgrass. Finite land available for production would continue to drive up prices for other grains, just as corn has raised prices for soybeans and wheat. "We would have to steal land away from corn to grow a different energy-related crop, so now you have that competition again," Good said. Irwin says food costs have likely seen the worst of the shift to higher-priced grain after posting 5 to 6 percent increases this year. But he warned that commodities account for just 20 percent of food costs, so prices could still rise to cover labor, transportation or other expenses.

Good and Irwin say Illinois farmers posted record earnings in 2007, and likely will again this year. But profits will ultimately dip back to historical levels of roughly $50 to $60 an acre as land and production costs rise to keep pace with new era prices.  "The real winners in this are landowners," Irwin said. "If history is any guide, we will see every ounce of the operating margin bid into land and cash rents."

Following that comment, note this: "The Palmer European Farmland Fund (PEFF), launched in 2008, is designed to profit from the long-term rising world demand for soft commodities and the convergence in land prices for farmland between Western and Eastern Europe.  The investment vehicle is the largest product of its kind to date and is being positioned as the only direct investing, EU-based farmland fund for institutional investors.  The fund is projecting an average net income return of 5.5% per annum over the 10-year fund life. When combined with the envisaged significant capital growth in land prices over this period, net returns are expected to be in the region of 10 – 15% per annum."


FAO’s position and questions:  "Prices of most agricultural food commodities have risen sharply during the past two years. Several factors have contributed to this development: (1) low levels of world stocks (especially for wheat and maize) following two years of below-average harvests in Europe in 2006 and 2007; (2) crop failures in major producing countries like Australia in 2006 and 2007; (3) rapidly growing demand for grain-based biofuel production supported by subsidies; (4) gradual changes in agricultural policies of the OECD countries, where reduced levels of subsidies have led to lower surplus production."  SEE ALSO: FAO: State of Agricultural Commodity Markets, 2009

[The weak dollar has also contributed to increased prices, since importers are shielded from increasing dollar prices by a weakening of the vlaue of the dollar itself.  In addition, there continues to be steady growth in demand, as a result of world economic growth, especially in China and India, and (perhaps), a weakening increase in technological improvement on the supply side - reflecting a slow down, if not actual reduction, in R&D resources for primary agriculture word-wide. Note, too, though, that the URAA/WTO reduction in protection should have made world prices less volatile than with previous strong protection - see previous notes]


The European Commission (op. cit., p 33) says, based on a review of existing major analyses of the world situation by the FAO/OECD, "Whilst caution is necessary in asserting that we have entered a new period of strong market prices after two decades of price decreases, it is becoming increasingly clear that structural factors like the growth in global food demand can be reasonably expected to maintain prices at sustained levels over the medium-term, though below the most recent price hikes."

In conclusion, the European Commission (op. cit., p 42) concludes:

"Contributing to the uncertainty of (forecast futures) is an increasing number and occurrence of uncertain factors compared to previous projection periods. Among those are:
  1. Global economic environment, including economic and population growth, development of exchange rates, etc. Global economic environment also influences the level of capital flows into commodity markets.
  2. petroleum prices
  3. evolution of energy policies (biofuels)
  4. research and development, technology, including in the domain of second generation biofuels, evolution of yields<> potential introduction of new land into production (although might be risking they could be in environmentally prone areas likely to be most affected by climate change
  5. developments in agricultural and trade policies
  6. climate change and weather related factors, both short term and longer term, such as water shortages, increases in global temperatures
  7. addressing issues of climate change, creation of carbon sink markets (if ever) will also be competing for land (food and feed, energy, carbon sequestration).
See, also:
International Food Policy Research Institute (IFPRI) IFPRI food prices
World Bank on Food Crisis

And IFPRI: Global Food Prices:  How did it happen? How does it hurt?  What can we do to prevent the next one?  IFPRI Research Monograph, Heady and Fan, 2010.

Speculation and the commodity price spike?
There is little evidence of the undoubted increase in speculative activity in the commodity futures markets having substantially affected the spot prices for these commodities, although this increased activity has been associated with poorer performance of these markets in providing: liquidity (the necessary volume of trades to provide sufficient scope for both sides of the market to complete their intended deals - A liquid market is one that has enough contracts outstanding to allow large transactions without a substantial change in price); volatility (a measure of the emergence of new and unexpected market information. Some level of price volatility is desirable and necessary to attract trading activity, but extreme volatility can also discourage participation by some sectors of the market; convergance (the pattern of cash and futures prices tending to come together, that is, basis approaching zero, at the delivery market as the futures contract expires. In theory, arbitrage in the cash and futures market should force the prices to converge. If futures are above the cash price, we expect that the cash commodity will be bought, futures sold, and delivery made. If the cash price exceeded futures, users could buy futures and stand for delivery.)

Principles of Futures Markets  see: Lerner & Rudderow, 2000; or  Hurt & Wisner, 2002; or the ubiquitous Wikipedia (Futures Exchange)
[For a more detailed discussion of research on futures markets, see Carter, 1999, Australian Journal of Agricultural and Resource Economics, 43 (2), 209-247.]
See Bayley, 2012, for a recent (2012) briefing on the role of speculation in the food price spikes (developed for the Treasury by Brendan Bayley, Head, Agricultural and Regional Policy Branch, European Union Institutions and Policy, HMT, October, 2012)

Irwin et al, May, 2007, conclude:
Three attributes of futures contract behavior important for market performance—liquidity, volatility, and convergence—are investigated before and after the 2005 increase in speculative
position limits for corn, soybean, and wheat contracts at the Chicago Board of Trade. The analysis of liquidity and market depth reveals a sharp increase in open interest for corn, soybeans and wheat beginning in late 2005. The increase in position limits likely accommodated the increase in speculative interest in corn, soybean and wheat futures, but some of the increase would have occurred without the increase as new market participants received hedge exemptions. The analysis of price volatility revealed no large change in measures of volatility after the change in speculative limits. For corn and soybeans, the picture that unfolds relative to convergence patterns is one of weakness, but not failure. For wheat, the picture that unfolds relative to convergence patterns is not only one of weakness, but failure to accomplish one of the fundamental tasks of a futures market. The persistence and growing magnitude of the delivery location basis in wheat suggests a problem with the contract specifications.

See, e.g. a recent and thorough examination of the performance of the US commodity futures markets (Corn, Wheat and Soybeans) by Scott Irwin, Philip Garcia, and Darrel Good, University of Illionois

See, also, Economist, November 11th, 2010: Commodity speculators: Dr Evil, or drivel? The charge-sheet against commodity speculators is flimsy. But IFPRI (2009) suggest that there is some evidence that 'excessive' speculation increases the volatility of commodity prices.
In October 2011, "the US Commodity Futures Trading Commission approved limits on trading in the commodities markets. Specifically, the new rules limit the number of commodity contracts that any investor can hold in agriculture, energy, or metals contracts. The trade limits, originally mandated in the Dodd-Frank Financial Reform Act which was passed in July 2010, stemmed from worldwide concerns that commodity index and other funds contributed to the 2008 surge in food and fuel prices, and could again be contributing to recent price spikes. The new rules are intended to prevent commodities markets from becoming too concentrated, which can lead to speculation and market manipulation. Under the new limits, a single trader would be allowed to hold spot month positions equal to 25% of the estimated physical deliverable supply of a given commodity." (IFPRI Food Security Portal)

See, also, Scott Irwin: "Does the Masters Hypothesis Explain Recent Food Price Spikes?" - IAAE Conference plenary session, August 2012. Abstract: "The Masters Hypothesis is the claim that unprecedented buying pressure in recent years from commodity index investors created massive bubbles in food and energy prices. A number of recent studies investigate the empirical relationship between index investment and price movements in agricultural futures markets.
One line of research uses time-series regression tests, such as Granger causality tests, to investigate the relationship between price movements and index positions. This research provides little evidence in support of the Masters Hypothesis in agricultural futures markets.
A second line of research uses cross-sectional regression tests and studies in this area provide very limited evidence in favor of the Masters Hypothesis for agricultural futures markets.
A third line of research investigates whether there is a significant relationship between commodity index trading and the difference, or spread, between futures prices of different contract maturities. These studies report a range of results depending on the type of test. However, the bulk of the evidence indicates either no relationship or a negative relationship, which is once again inconsistent with the Masters Hypothesis.
Overall, this growing body of literature fails to find compelling evidence that buying pressure from commodity index investment in recent years caused a massive bubble in agricultural futures
prices. The Masters Hypothesis is simply not a valid characterization of reality."

The Future?

2010/11 Threatens to provide another major spike - see, eg.. FAO. - One trillion food import bill as prices rise International community must be aware of possibility of even higher food prices in 2011

See, also Jo Swinnen on The Right Price of Food (May 2010) "Only a few years ago the widely shared view was that low food prices were a curse to developing countries and the poor. The dramatic increase of food prices in 2006-2008 appears to have fundamentally altered this view. The vast majority of analyses and reports in 2008 and 2009 state that high food prices have a devastating effect on developing countries and the world’s poor. This reversal of opinion raises questions about the old and the new arguments and about the proposed remedies. It also raises questions about the causes of this dramatic turnaround in analysis and policy conclusions. In this paper I document these changes in perspective and I discuss potential implications and offer hypotheses on the cause of the change in views."

For the latest (2011) Global Market situation and assessement, see FAO GIEWS (Global Information and Early Warning System) Final Food Outlook (Nov. 11) "a comprehensive analysis of the global agricultural market situation. According to the report, the outlook for the agricultural commodities markets remains difficult to predict; despite improved supply prospects and weakening demand for several important commodities, volatile prices and the uncertain global economic situation continue to play a part in high food prices.  The report provides market assessments and summaries for staple commodities such as wheat, rice, and oilseeds, as well as cassava, sugar, dairy products, and meat.  November's report also introduces the Agricultural Market Information System (AMIS), the initiative established by the G20 to enhance transparency and information-sharing regarding global agricultural markets. A major challenge to food security worldwide is a dearth of accurate, timely information. AMIS aims to address this challenge through monitoring, analysis, and interpretation of markets and policy developments."  NOTE IFPRI's Food Security Portal  has a number of "Policy Analysis Tools" which are provided to help policy makers respond appropriately to market developments. & also a more recent analysis of self-reported food insecurity during the 2008 food price crisis: Verporten et al, 2012, LICOS discussion paper 303.

Back to ACE2006 Index.

Comments or Questions?