|
Impacts of climate change on the Yorkshire water resource system |
Published in:
Fowler, H.J., Kilsby, C.G., and O’Connell, P.E. 2003. Modeling the impacts of climatic change and variability on the reliability, resilience and vulnerability of a water resource system. Water Resources Research, 39(8), 1222, doi:10.1029/2002WR001778. [Abstract]
Also see this link for work examining impacts on the northwest water resource system.
Water resource systems in the UK are very sensitive to climatic variations. During the late 1980s and early 1990s there were numerous water resource drought events, culminating in the very serious drought of 1995-96. In Yorkshire this drought had an estimated rainfall return period from April to August 1995 of more than 200 years (Marsh 1996) and necessitated the emergency measure of bringing water in by road tanker from outside the region. Future climate change scenarios suggest that summer reductions and winter increases in rainfall as high as -50% and 30% respectively (Hulme et al. 2002). These changes will have serious implications for water resource systems management.
In Yorkshire, annual rainfall varies from just 600mm in the eastern lowlands, to over 2000mm at high Pennine sites, and the main sources of rainfall are weather systems from the westerly quadrant. This has led to the installation of single-season reservoir sources in the west of the region which, along with some groundwater resources in the the east, supply most of the region's water (Figure 1).
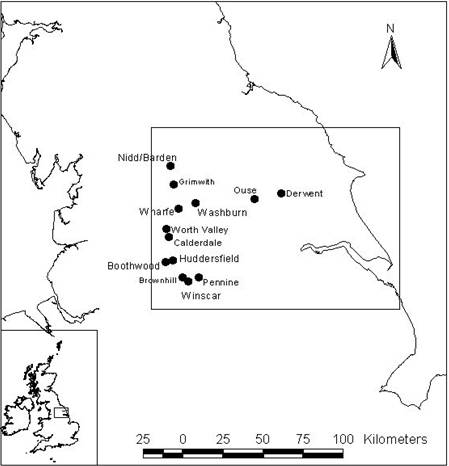
Figure 1 The Yorkshire region, UK, showing location of major river and reservoir water resources
Here, we use RRV analysis (Hashimoto et al. 1982a,b) to examine the impacts of climate change and variability on the reliability, reliance and vulnerability of water supplies in the Yorkshire region, UK. An integrated methodology is presented for modelling the impacts of both climate change and variability upon a complex water resource system. This distinction is important as increased climatic variability may have a larger impact upon water resource system performance than change to mean climate.
RRV analysis
The use of indices of reliability, resilience and vulnerability (RRV) for classifying and evaluating water resource system performance was first suggested by Hashimoto et al. (1982a, b). These indicators are used to examine the performance of the Yorkshire water resource system for each scenario, evaluating the outputs of the water resource system with reference to the imposed demands.
Firstly, a criterion, C, is defined for each water supply source, where an unsatisfactory value is one where the source is unable to provide a pre-specified yield, using either reservoir control rules or river abstraction limits (see Figure 2 for example). The time series of simulated daily values of either river flows or reservoir levels, Xt, are then evaluated to some future time, T. Each water supply source will have its own range of satisfactory, S, and unsatisfactory, U, values defined by the criterion, C (Hashimoto et al., 1982a,b):
If
![]() then
then ![]() and
and
![]()
else ![]() and
and
![]()
Another indicator is defined, Wt, which indicates a transition from an unsatisfactory to a satisfactory state (Hashimoto et al., 1982a,b):

If the periods of unsatisfactory Xt are then defined as J1, J2, …, JN then reliability, resilience and vulnerability indices can be defined (Hashimoto et al., 1982a,b):
Reliability:

Resilience:

Vulnerability:

These measures are used to examine the reliability, resilience and vulnerability of the water sources within the Yorkshire water resource system for the baseline and future climate change scenarios. Reliability, CR, measures the frequency of source failures. Resilience, CRS, gives an indication of the speed of recovery of the source from a failure and vulnerability, CV, is a measure of the extent of failure. Failure is defined as when the source is unable to provide a pre-specified yield.
Impacts of climate change and variability on the Yorkshire water resource system
The Yorkshire water resource system is shown in Figure 2 below:
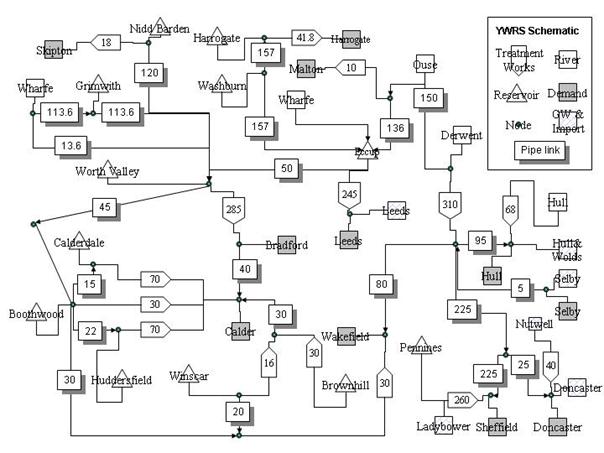
Figure 2 A schematic of the Yorkshire water resource system (YWRS) model. River abstractions, reservoir abstractions, groundwater abstractions and imports and demands are modeled. The model also includes pipe capacity and water treatment work size restrictions upon the supply of water within the system. Pipe capacities and treatment work capacities are given in mega-liters (or thousand cubic meters) per day.
The study analysed the impact of natural climatic variability by way of the North Atlantic Oscillation (NAO) and climate change using the UKCIP98 scenarios (Hulme and Jenkins, 1998) (the predecessor to the UKCIP02 scenarios). Changes to winter and summer mean rainfall resulting from a high- or low-phase NAO can be found in Table 1. Similarly, changes suggested by the UKCIP98 scenarios can be found in Table 2.
|
|
|
High-phase NAO % change from Baseline |
Low-phase NAO % change from Baseline |
|
East |
Summer |
+0.0 |
+5.0 |
|
|
Winter |
+1.0 |
-2.0 |
|
|
|
|
|
|
West |
Summer |
-1.0 |
+6.0 |
|
|
Winter |
+2.0 |
-4.0 |
Table 1 Changes to winter and summer mean rainfall resulting from a high- or low-phase NAO when compared to the baseline scenario of 1961-90
|
Season |
2021-2050 |
2051-2080 |
||||
|
|
Rainfall Change (%) |
Rainfall Variance Change (%) |
PE Change (%) |
Rainfall Change (%) |
Rainfall Variance Change (%) |
PE Change (%) |
|
Summer |
-5 |
+10 |
+6 |
-9 |
+10 |
+8 |
|
Winter |
+9 |
+5 |
0 |
+16 |
+15 |
+10 |
|
Annual |
+3 to +5 |
- |
+6 |
+4 to +10 |
- |
+10 |
'Weathersim', a coupled semi-Markov weather
generator and the NSRP model, was used to generate rainfall scenarios. These
were converted to flows using the ADM model, calibrated for each water resource
using historic data.
Water resource
system behavior was examined for: (a) a control climate using observed data from
the period 1961-1990 in a ‘baseline’ scenario, (b) climate variability using the
examples of the high- and low-phase NAO, and (c) a future climate scenario for
the periods 2021-2050 and 2051-2080. Results can be found in
Table 3.
|
Scenario |
Change in annual PE (% from baseline) |
% change in rainfall amount and (variability) from baseline |
% change in average water supply reliability from baseline |
% change in total system resilience from baseline |
% change in total system vulnerability from baseline (absolute values shown in parentheses) |
Return period of 1995 drought event (years) |
||
|
|
|
Winter |
Summer |
|
|
Duration (Days) |
Extent (Ml) |
|
|
Baseline (1961-90) |
- |
- |
- |
- |
- |
- (165) |
- (74562) |
170 |
|
High-NAO |
- |
+2 |
-1 |
-0.1 |
-1.2 |
+14.5 (189) |
+12.8 (84115) |
100 |
|
Low-NAO |
- |
-3 |
+5 |
+1.3 |
+0.6 |
-9.1 (150) |
-0.8 (73955) |
1000 |
|
2021-2050
|
+6 |
+9 (+5) |
-5 (+10) |
0.0 |
-10.7 |
+18.8 (196) |
+8.8 (81138) |
140 |
|
2051-2080
|
+10 |
+16 (+15) |
-9 (+10) |
-0.3 |
-17.8 |
+34.5 (222) |
+9.9 (95504) |
125 |
Table 3 Summary of water resource system performance results as percentage change from the baseline scenario (1961-90). Absolute drought duration in days and extent in total mega-liters are bracketed for each scenario. The return period for the 1995-96 drought event is calculated using a simple frequency approach, i.e. a drought is counted as a 1995-96 magnitude event if the duration of water supply failure exceeds 147 days (the water supply failure duration of the system simulated during 1995-96), and the number 1995-96 drought events counted during the 1000-yr simulation is simply divided by 1000 to estimate the return period of the 1995-96 drought event.
This study has shown that water resources in Yorkshire are likely to become increasingly vulnerable to severe drought events under future climate change. However, natural climate variability may play an equally important role in the frequency of drought events and their magnitude within Yorkshire and elsewhere in the UK. A high-phase NAO enhances seasonality and causes a reduction in summer rainfall and increased winter rainfall across much of the UK. The opposite effects are true of the low-phase NAO. In terms of water resources, if the underlying trend from the 1970s towards a higher NAO, with associated higher winter temperatures and a steeper northwest to southeast rainfall gradient, continues then there may be serious drought concerns. If climate projections are accurate then the NAO is likely to continue its recent positive trend (Hulme et al., 2002). This will have severe implications for water resource systems in the north of the UK where there is a reliance on surface water sources.
The results of this investigation into the effects of natural climatic variability and future climate change on water resources in Yorkshire therefore suggest that:
1. Current natural climatic variability may produce more frequent severe drought events than is estimated for the examined future climate change scenario, which also includes estimates of natural variability;
2. For the future climate scenarios (2021-2050 and 2051-2080), model results suggest an increased vulnerability to severe drought, with increases in both magnitude and duration. This is due to a combination of increases in summer PE and declining summer rainfall that will increase the likelihood of summer water shortages;
3. Although an increase in winter rainfall will improve water resource reliability on average, increased variability coupled with decreased summer rainfall may lower system resilience and mean that more severe drought will occur in regions reliant on single-season reservoirs than under current climatic conditions;
4. The largest impact on the Yorkshire water supply system comes from increased frequency of low flows in rivers during summer drought events. The reliability of river sources is substantially reduced for both the 2021-2050 and 2051-1080 scenarios, particularly in terms of the increased frequency of flow rates where no abstraction is allowed.
5. The frequency of drought is only slightly raised. The return period for a 1995-1996 magnitude drought event is lowered from 170 years to 140 years for the 2021-2050 scenario and 125 years for the 2051-2080 scenario. However, more importantly, in terms of total system vulnerability, these droughts will be more extensive in both magnitude and duration than severe historical droughts, and may develop more rapidly.
References
Hashimoto, T., D. P. Loucks, and J. R. Stedinger, Robustness of water resources systems, Water Resour. Res., 18, 21-26, 1982a.
Hashimoto, T., J. R. Stedinger, and D. P. Loucks, Reliability, resiliency, and vulnerability criteria for water resource system performance evaluation, Water Resour. Res., 18, 14-20, 1982b.
Hulme, M., and G. J. Jenkins, Climate change scenarios for the UK: scientific report, UKCIP Technical Report No. 1, Climatic Research Unit, Norwich, 80pp, 1998.
Hulme, M., G. J. Jenkins, X. Lu, J. R. Turnpenny, T. D. Mitchell, R. G. Jones, J. Lowe, J. M. Murphy, D. Hassell, P. Boorman, R. McDonald, and S. Hill, Climate Change Scenarios for the United Kingdom: The UKCIP02 Scientific Report, Tyndall Centre for Climate Change Research, School of Environmental Sciences, University of East Anglia, Norwich, UK, 120pp, 2002.