| Output Created | 30-NOV-2005 16:36:35 | |
|---|---|---|
| Comments | ||
| Input | Data | H:\work\iamsect\questionnaire\jon-iamsect-questionnaire.sav |
| Filter | role = 'i' or role = 'as' or role = 'l' or role = 'm' (FILTER) | |
| Weight | <none> | |
| Split File | <none> | |
| N of Rows in Working Data File | 90 | |
| Missing Value Handling | Definition of Missing | User-defined missing values are treated as missing. |
| Cases Used | Statistics are based on all cases with valid data. | |
| Syntax | FREQUENCIES VARIABLES=region role owncompu owninter skills institut otheruni fei nhs commisp numtypeu chunked numisacc chunked2 freqemai freqwww freqchat freqsa freqprog freqlibs locate written variety tools policy athens numathen shib shibop /BARCHART PERCENT /ORDER= ANALYSIS . |
|
| Resources | Total Values Allowed | 149796 |
| Elapsed Time | 0:00:00.11 | |
| In which region do you primarily work or study? | Which of the following groups do you think best describes your role? | Do you have your own computer at home? | Do you access the Internet from home? | How do you rate your computer skills? | Of which of the following institutions do you hold a computer account? | How many other Universities do you have a computer account with? | How many further education institutions do you have a computer account with? | How many NHS Trusts do you have a computer account with? | How many commercial ISPs do you have a computer account with? | How many times in an average day do you type in a username and password? | CHUNKED | How many Internet service accounts (e.g. Amazon, Ebay, The Train Line, etc.) do you have? | CHUNKED2 | Which services do you use most frequently for work or study? email | World Wide Web | Chat | Software Applications | Programming | Online Libraries / Journals | How do you most frequently locate on-line resources? | Do you keep a written record of your computer accounts? | Do you use a different password for each account? | Do you use a tool to help manage computer accounts? For example, relying on your browser to remember passwords. | Does your Institution's computer security policy mention the use of tools to manage computer accounts? | Have you heard of Athens? | How many Athens accounts do you have? | Have you heard of Shibboleth? | What do you think of Shibboleth? | ||
|---|---|---|---|---|---|---|---|---|---|---|---|---|---|---|---|---|---|---|---|---|---|---|---|---|---|---|---|---|---|---|
| N | Valid | 90 | 90 | 89 | 90 | 90 | 89 | 90 | 90 | 90 | 90 | 90 | 90 | 90 | 90 | 89 | 90 | 89 | 89 | 90 | 90 | 90 | 88 | 88 | 89 | 89 | 88 | 88 | 89 | 80 |
| Missing | 0 | 0 | 1 | 0 | 0 | 1 | 0 | 0 | 0 | 0 | 0 | 0 | 0 | 0 | 1 | 0 | 1 | 1 | 0 | 0 | 0 | 2 | 2 | 1 | 1 | 2 | 2 | 1 | 10 | |
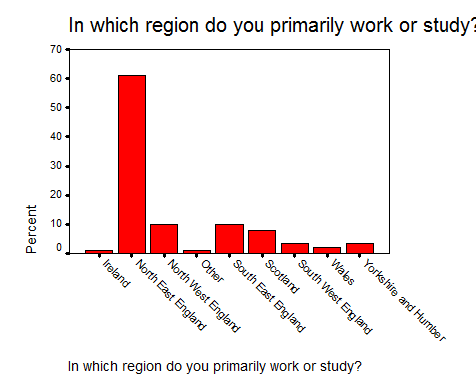
| Frequency | Percent | Valid Percent | Cumulative Percent | ||
|---|---|---|---|---|---|
| Valid | Ireland | 1 | 1.1 | 1.1 | 1.1 |
| North East England | 55 | 61.1 | 61.1 | 62.2 | |
| North West England | 9 | 10.0 | 10.0 | 72.2 | |
| Other | 1 | 1.1 | 1.1 | 73.3 | |
| South East England | 9 | 10.0 | 10.0 | 83.3 | |
| Scotland | 7 | 7.8 | 7.8 | 91.1 | |
| South West England | 3 | 3.3 | 3.3 | 94.4 | |
| Wales | 2 | 2.2 | 2.2 | 96.7 | |
| Yorkshire and Humberside | 3 | 3.3 | 3.3 | 100.0 | |
| Total | 90 | 100.0 | 100.0 | ||
| Frequency | Percent | Valid Percent | Cumulative Percent | ||
|---|---|---|---|---|---|
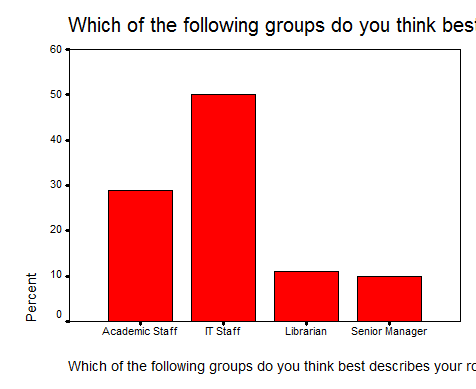
| Valid | Academic Staff | 26 | 28.9 | 28.9 | 28.9 |
| IT Staff | 45 | 50.0 | 50.0 | 78.9 | |
| Librarian | 10 | 11.1 | 11.1 | 90.0 | |
| Senior Manager | 9 | 10.0 | 10.0 | 100.0 | |
| Total | 90 | 100.0 | 100.0 | ||
| Frequency | Percent | Valid Percent | Cumulative Percent | ||
|---|---|---|---|---|---|
| Valid | No | 5 | 5.6 | 5.6 | 5.6 |
| Yes | 84 | 93.3 | 94.4 | 100.0 | |
| Total | 89 | 98.9 | 100.0 | ||
| Missing | . | 1 | 1.1 | ||
| Total | 90 | 100.0 | |||
| Frequency | Percent | Valid Percent | Cumulative Percent | ||
|---|---|---|---|---|---|
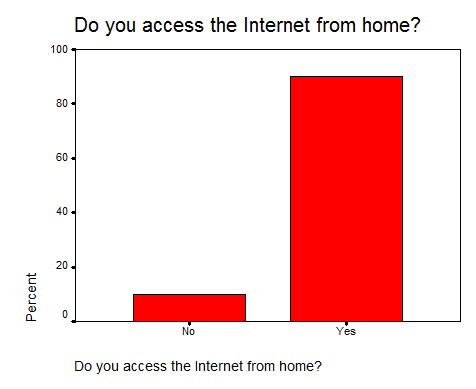
| Valid | No | 9 | 10.0 | 10.0 | 10.0 |
| Yes | 81 | 90.0 | 90.0 | 100.0 | |
| Total | 90 | 100.0 | 100.0 | ||
| Frequency | Percent | Valid Percent | Cumulative Percent | ||
|---|---|---|---|---|---|
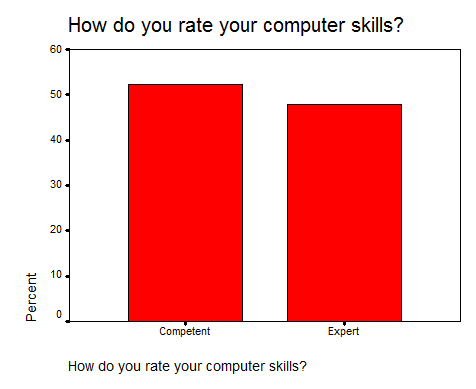
| Valid | Competent | 47 | 52.2 | 52.2 | 52.2 |
| Expert | 43 | 47.8 | 47.8 | 100.0 | |
| Total | 90 | 100.0 | 100.0 | ||
| Frequency | Percent | Valid Percent | Cumulative Percent | ||
|---|---|---|---|---|---|
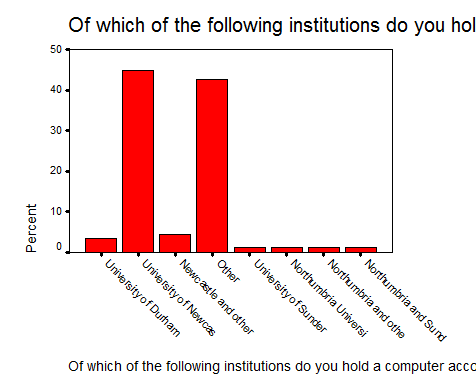
| Valid | University of Durham | 3 | 3.3 | 3.4 | 3.4 |
| University of Newcastle | 40 | 44.4 | 44.9 | 48.3 | |
| Newcastle and other | 4 | 4.4 | 4.5 | 52.8 | |
| Other | 38 | 42.2 | 42.7 | 95.5 | |
| University of Sunderland | 1 | 1.1 | 1.1 | 96.6 | |
| Northumbria University | 1 | 1.1 | 1.1 | 97.8 | |
| Northumbria and other | 1 | 1.1 | 1.1 | 98.9 | |
| Northumbria and Sunderland | 1 | 1.1 | 1.1 | 100.0 | |
| Total | 89 | 98.9 | 100.0 | ||
| Missing | . | 1 | 1.1 | ||
| Total | 90 | 100.0 | |||
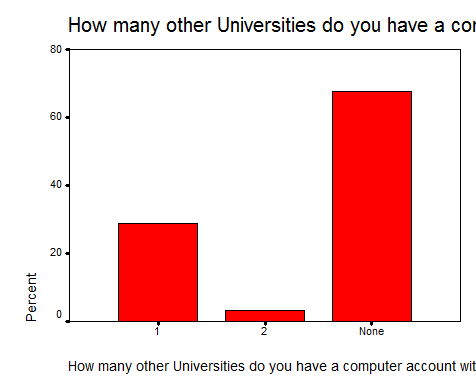
| Frequency | Percent | Valid Percent | Cumulative Percent | ||
|---|---|---|---|---|---|
| Valid | 1 | 26 | 28.9 | 28.9 | 28.9 |
| 2 | 3 | 3.3 | 3.3 | 32.2 | |
| None | 61 | 67.8 | 67.8 | 100.0 | |
| Total | 90 | 100.0 | 100.0 | ||
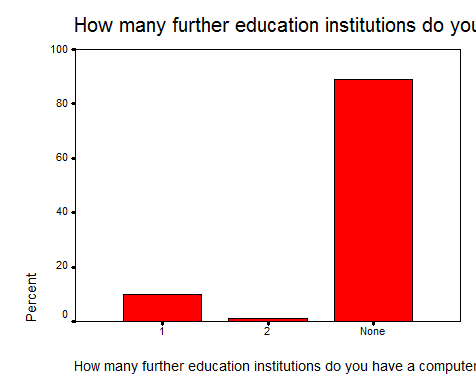
| Frequency | Percent | Valid Percent | Cumulative Percent | ||
|---|---|---|---|---|---|
| Valid | 1 | 9 | 10.0 | 10.0 | 10.0 |
| 2 | 1 | 1.1 | 1.1 | 11.1 | |
| None | 80 | 88.9 | 88.9 | 100.0 | |
| Total | 90 | 100.0 | 100.0 | ||
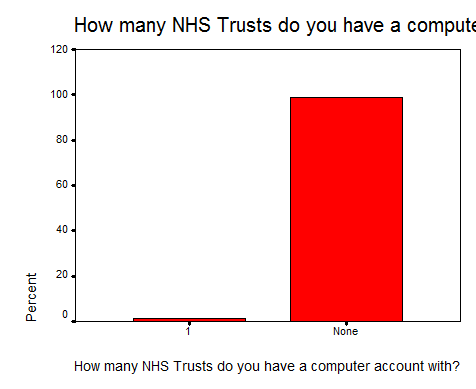
| Frequency | Percent | Valid Percent | Cumulative Percent | ||
|---|---|---|---|---|---|
| Valid | 1 | 1 | 1.1 | 1.1 | 1.1 |
| None | 89 | 98.9 | 98.9 | 100.0 | |
| Total | 90 | 100.0 | 100.0 | ||
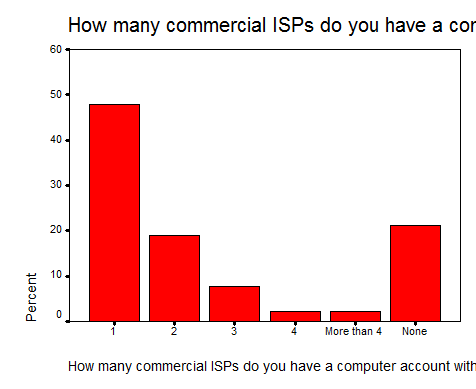
| Frequency | Percent | Valid Percent | Cumulative Percent | ||
|---|---|---|---|---|---|
| Valid | 1 | 43 | 47.8 | 47.8 | 47.8 |
| 2 | 17 | 18.9 | 18.9 | 66.7 | |
| 3 | 7 | 7.8 | 7.8 | 74.4 | |
| 4 | 2 | 2.2 | 2.2 | 76.7 | |
| More than 4 | 2 | 2.2 | 2.2 | 78.9 | |
| None | 19 | 21.1 | 21.1 | 100.0 | |
| Total | 90 | 100.0 | 100.0 | ||
| Frequency | Percent | Valid Percent | Cumulative Percent | ||
|---|---|---|---|---|---|
| Valid | 1 | 1 | 1.1 | 1.1 | 1.1 |
| 16-30 | 8 | 8.9 | 8.9 | 10.0 | |
| 38473 | 32 | 35.6 | 35.6 | 45.6 | |
| 42155 | 39 | 43.3 | 43.3 | 88.9 | |
| More than 30 | 8 | 8.9 | 8.9 | 97.8 | |
| None | 2 | 2.2 | 2.2 | 100.0 | |
| Total | 90 | 100.0 | 100.0 | ||
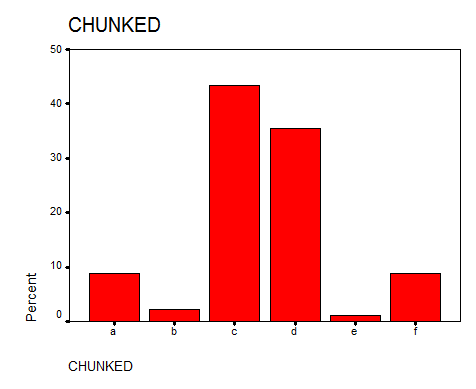
| Frequency | Percent | Valid Percent | Cumulative Percent | ||
|---|---|---|---|---|---|
| Valid | a | 8 | 8.9 | 8.9 | 8.9 |
| b | 2 | 2.2 | 2.2 | 11.1 | |
| c | 39 | 43.3 | 43.3 | 54.4 | |
| d | 32 | 35.6 | 35.6 | 90.0 | |
| e | 1 | 1.1 | 1.1 | 91.1 | |
| f | 8 | 8.9 | 8.9 | 100.0 | |
| Total | 90 | 100.0 | 100.0 | ||
| Frequency | Percent | Valid Percent | Cumulative Percent | ||
|---|---|---|---|---|---|
| Valid | 38411 | 19 | 21.1 | 21.1 | 21.1 |
| 38506 | 17 | 18.9 | 18.9 | 40.0 | |
| 38631 | 22 | 24.4 | 24.4 | 64.4 | |
| More than 10 | 30 | 33.3 | 33.3 | 97.8 | |
| None | 2 | 2.2 | 2.2 | 100.0 | |
| Total | 90 | 100.0 | 100.0 | ||
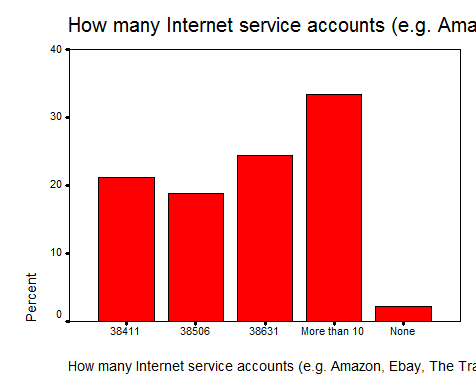
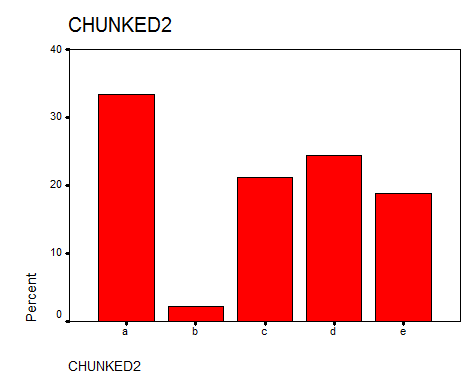
| Frequency | Percent | Valid Percent | Cumulative Percent | ||
|---|---|---|---|---|---|
| Valid | a | 30 | 33.3 | 33.3 | 33.3 |
| b | 2 | 2.2 | 2.2 | 35.6 | |
| c | 19 | 21.1 | 21.1 | 56.7 | |
| d | 22 | 24.4 | 24.4 | 81.1 | |
| e | 17 | 18.9 | 18.9 | 100.0 | |
| Total | 90 | 100.0 | 100.0 | ||
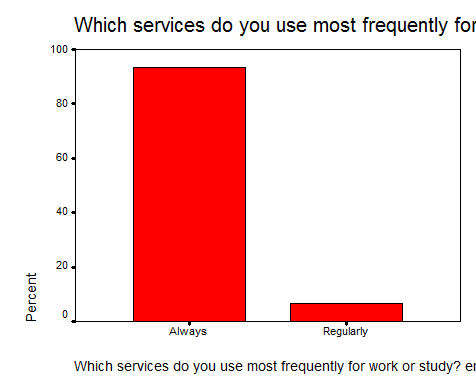
| Frequency | Percent | Valid Percent | Cumulative Percent | ||
|---|---|---|---|---|---|
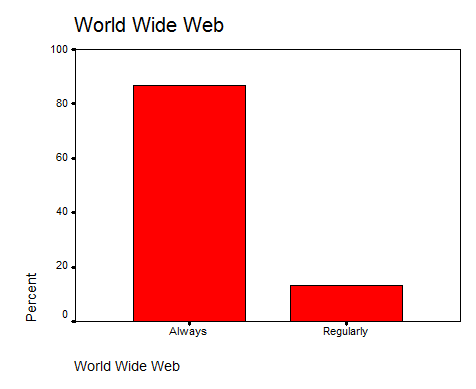
| Valid | Always | 83 | 92.2 | 93.3 | 93.3 |
| Regularly | 6 | 6.7 | 6.7 | 100.0 | |
| Total | 89 | 98.9 | 100.0 | ||
| Missing | . | 1 | 1.1 | ||
| Total | 90 | 100.0 | |||
| Frequency | Percent | Valid Percent | Cumulative Percent | ||
|---|---|---|---|---|---|
| Valid | Always | 78 | 86.7 | 86.7 | 86.7 |
| Regularly | 12 | 13.3 | 13.3 | 100.0 | |
| Total | 90 | 100.0 | 100.0 | ||
| Frequency | Percent | Valid Percent | Cumulative Percent | ||
|---|---|---|---|---|---|
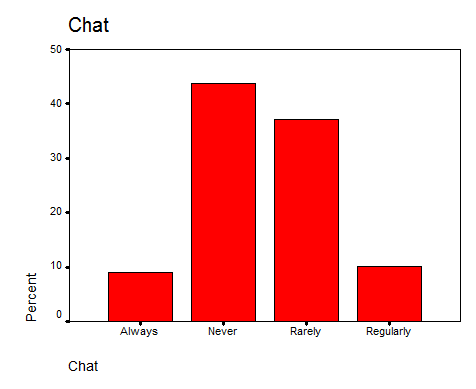
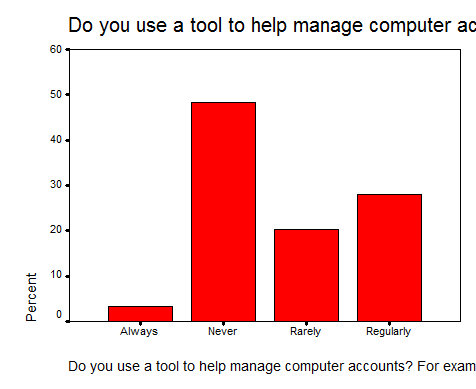
| Valid | Always | 8 | 8.9 | 9.0 | 9.0 |
| Never | 39 | 43.3 | 43.8 | 52.8 | |
| Rarely | 33 | 36.7 | 37.1 | 89.9 | |
| Regularly | 9 | 10.0 | 10.1 | 100.0 | |
| Total | 89 | 98.9 | 100.0 | ||
| Missing | . | 1 | 1.1 | ||
| Total | 90 | 100.0 | |||
| Frequency | Percent | Valid Percent | Cumulative Percent | ||
|---|---|---|---|---|---|
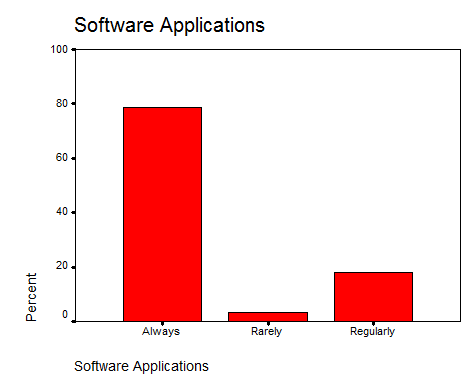
| Valid | Always | 70 | 77.8 | 78.7 | 78.7 |
| Rarely | 3 | 3.3 | 3.4 | 82.0 | |
| Regularly | 16 | 17.8 | 18.0 | 100.0 | |
| Total | 89 | 98.9 | 100.0 | ||
| Missing | . | 1 | 1.1 | ||
| Total | 90 | 100.0 | |||
| Frequency | Percent | Valid Percent | Cumulative Percent | ||
|---|---|---|---|---|---|
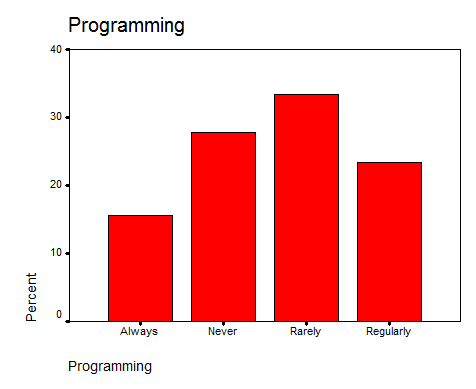
| Valid | Always | 14 | 15.6 | 15.6 | 15.6 |
| Never | 25 | 27.8 | 27.8 | 43.3 | |
| Rarely | 30 | 33.3 | 33.3 | 76.7 | |
| Regularly | 21 | 23.3 | 23.3 | 100.0 | |
| Total | 90 | 100.0 | 100.0 | ||
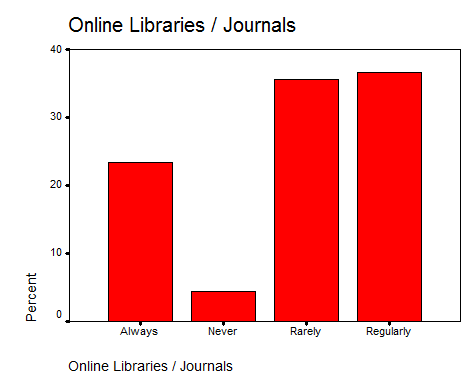
| Frequency | Percent | Valid Percent | Cumulative Percent | ||
|---|---|---|---|---|---|
| Valid | Always | 21 | 23.3 | 23.3 | 23.3 |
| Never | 4 | 4.4 | 4.4 | 27.8 | |
| Rarely | 32 | 35.6 | 35.6 | 63.3 | |
| Regularly | 33 | 36.7 | 36.7 | 100.0 | |
| Total | 90 | 100.0 | 100.0 | ||
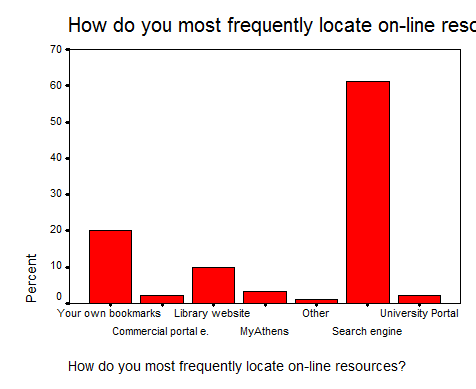
| Frequency | Percent | Valid Percent | Cumulative Percent | ||
|---|---|---|---|---|---|
| Valid | Your own bookmarks | 18 | 20.0 | 20.0 | 20.0 |
| Commercial portal e.g. Yahoo! | 2 | 2.2 | 2.2 | 22.2 | |
| Library website | 9 | 10.0 | 10.0 | 32.2 | |
| MyAthens | 3 | 3.3 | 3.3 | 35.6 | |
| Other | 1 | 1.1 | 1.1 | 36.7 | |
| Search engine | 55 | 61.1 | 61.1 | 97.8 | |
| University Portal | 2 | 2.2 | 2.2 | 100.0 | |
| Total | 90 | 100.0 | 100.0 | ||
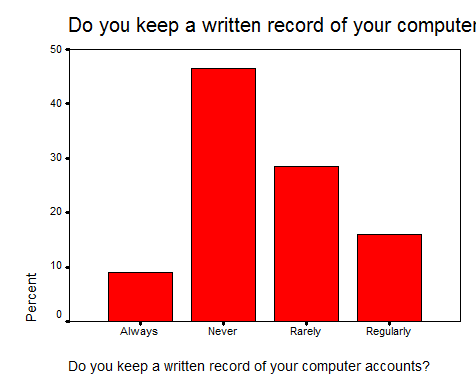
| Frequency | Percent | Valid Percent | Cumulative Percent | ||
|---|---|---|---|---|---|
| Valid | Always | 8 | 8.9 | 9.1 | 9.1 |
| Never | 41 | 45.6 | 46.6 | 55.7 | |
| Rarely | 25 | 27.8 | 28.4 | 84.1 | |
| Regularly | 14 | 15.6 | 15.9 | 100.0 | |
| Total | 88 | 97.8 | 100.0 | ||
| Missing | . | 2 | 2.2 | ||
| Total | 90 | 100.0 | |||
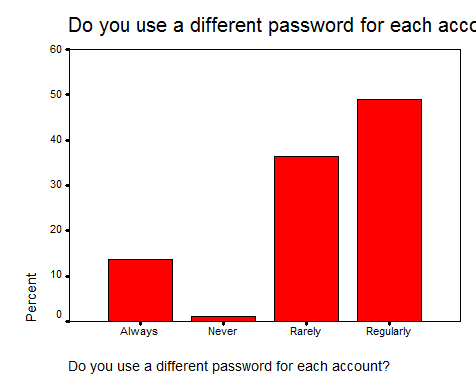
| Frequency | Percent | Valid Percent | Cumulative Percent | ||
|---|---|---|---|---|---|
| Valid | Always | 12 | 13.3 | 13.6 | 13.6 |
| Never | 1 | 1.1 | 1.1 | 14.8 | |
| Rarely | 32 | 35.6 | 36.4 | 51.1 | |
| Regularly | 43 | 47.8 | 48.9 | 100.0 | |
| Total | 88 | 97.8 | 100.0 | ||
| Missing | . | 2 | 2.2 | ||
| Total | 90 | 100.0 | |||
| Frequency | Percent | Valid Percent | Cumulative Percent | ||
|---|---|---|---|---|---|
| Valid | Always | 3 | 3.3 | 3.4 | 3.4 |
| Never | 43 | 47.8 | 48.3 | 51.7 | |
| Rarely | 18 | 20.0 | 20.2 | 71.9 | |
| Regularly | 25 | 27.8 | 28.1 | 100.0 | |
| Total | 89 | 98.9 | 100.0 | ||
| Missing | . | 1 | 1.1 | ||
| Total | 90 | 100.0 | |||
| Frequency | Percent | Valid Percent | Cumulative Percent | ||
|---|---|---|---|---|---|
| Valid | No | 23 | 25.6 | 25.8 | 25.8 |
| Unsure | 62 | 68.9 | 69.7 | 95.5 | |
| Yes | 4 | 4.4 | 4.5 | 100.0 | |
| Total | 89 | 98.9 | 100.0 | ||
| Missing | . | 1 | 1.1 | ||
| Total | 90 | 100.0 | |||
| Frequency | Percent | Valid Percent | Cumulative Percent | ||
|---|---|---|---|---|---|
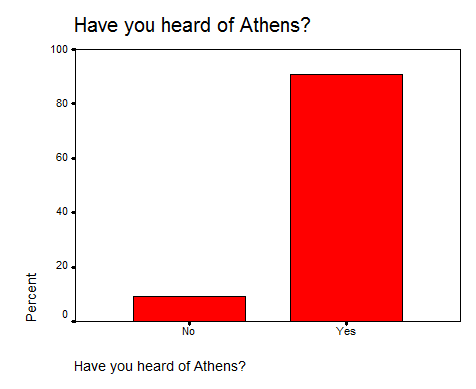
| Valid | No | 8 | 8.9 | 9.1 | 9.1 |
| Yes | 80 | 88.9 | 90.9 | 100.0 | |
| Total | 88 | 97.8 | 100.0 | ||
| Missing | . | 2 | 2.2 | ||
| Total | 90 | 100.0 | |||
| Frequency | Percent | Valid Percent | Cumulative Percent | ||
|---|---|---|---|---|---|
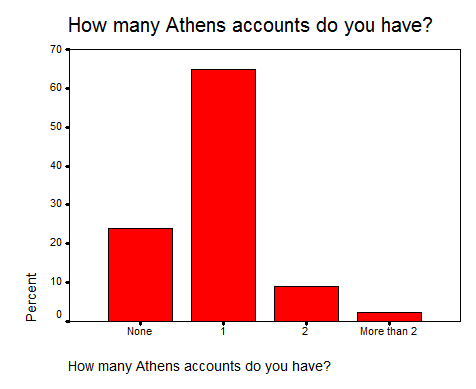
| Valid | None | 21 | 23.3 | 23.9 | 23.9 |
| 1 | 57 | 63.3 | 64.8 | 88.6 | |
| 2 | 8 | 8.9 | 9.1 | 97.7 | |
| More than 2 | 2 | 2.2 | 2.3 | 100.0 | |
| Total | 88 | 97.8 | 100.0 | ||
| Missing | . | 2 | 2.2 | ||
| Total | 90 | 100.0 | |||
| Frequency | Percent | Valid Percent | Cumulative Percent | ||
|---|---|---|---|---|---|
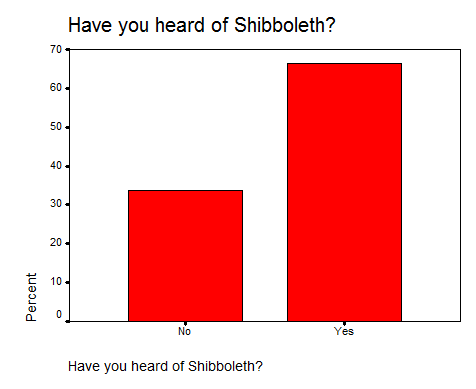
| Valid | No | 30 | 33.3 | 33.7 | 33.7 |
| Yes | 59 | 65.6 | 66.3 | 100.0 | |
| Total | 89 | 98.9 | 100.0 | ||
| Missing | . | 1 | 1.1 | ||
| Total | 90 | 100.0 | |||
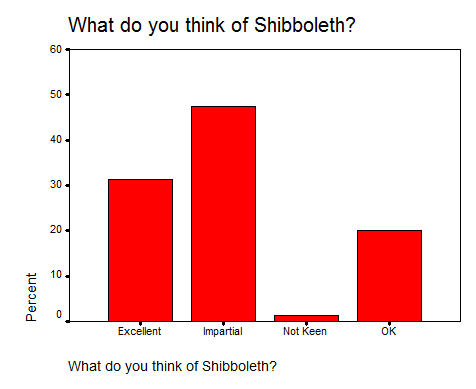
| Frequency | Percent | Valid Percent | Cumulative Percent | ||
|---|---|---|---|---|---|
| Valid | Excellent | 25 | 27.8 | 31.3 | 31.3 |
| Impartial | 38 | 42.2 | 47.5 | 78.8 | |
| Not Keen | 1 | 1.1 | 1.3 | 80.0 | |
| OK | 16 | 17.8 | 20.0 | 100.0 | |
| Total | 80 | 88.9 | 100.0 | ||
| Missing | . | 10 | 11.1 | ||
| Total | 90 | 100.0 | |||