Select the format in which molecular structures are to be shown:
- JSmol requires HTML 5.0, and can be slow
- Jmol requires Java to be installed on the client machine, but is sometimes much faster
Format currently selected: HTML5.0_JSmol
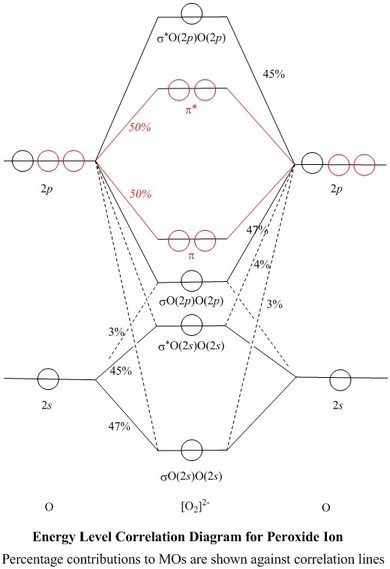
Molecular Orbitals for Peroxide Ion
Jmol models of calculated wavefunctions
To view a model, click on a molecular orbital in the energy level correlation diagram shown
Mouse Control of Models
Left mouse drag to rotate; Shift Left drag up or down to resize;
Shift Right drag or Shift Left drag horizontally to z-rotate;
Right click for menu
Notes
- This web page presents evidence from an ab initio
modelling calculation, which may be useful to those
learning or teaching about molecular orbitals for
simple inorganic species
- It does not set out to teach
- If you would like a tutorial aimed at students
following a beginners' course about atomic orbitals
and their linear combination to make molecular
orbitals, you could try
Tutorial using the program Orbital
Usage
- The orbitals models are shown in two popup windows, which are reused alternately so that
you can compare one orbital with another
- Contours on a two-dimensional plot correspond to surfaces in three dimensions
- The initial view of a model is with surfaces at ψ = ±0.04
- A radio button is provided to 'Switch contours on'. This shows a
two-dimensional contour plot in the yz plane. This calculation is
slow in the default HTML5.0_JSmol format for the structures:
calculating contours for an orbital takes about 5–10 seconds
in a good browser in a moderately fast PC (in 2018)
- You may see the contour plot better if you 'Switch surfaces off' and click
'Contours coloured'. Black and white contours are provided as the default because
the coloured ones do not show up very well through the coloured surfaces
- If you 'Switch ball and stick off' you can see contours right up to the nuclei,
and where a 2s orbital contributes much you may see its inner lobe with opposite
phase
The Species
- Peroxide ion, [O2]2–, has 14 valence-shell
electrons and is isoelectronic with fluorine, F2
- The formal bond order of [O2]2– is one,
since the effects of the bonding σO(2s)O(2s) orbital
and the two bonding π orbitals are notionally cancelled out
by the filled antibonding
σ*O(2s)O(2s) orbital and the two filled
π* orbitals respectively (but see
below)
- The bond order of one corresponds to there being one empty antibonding
valence shell orbital, σ*O(2p)O(2p)
- As its sodium salt, peroxide ion is much more readily handled than is F2,
but it is also a very strong oxidising agent
- Its protonated derivative H2O2, hydrogen peroxide,
is manufactured on a very large scale for making
bleaching and anti-microbial products
MOs and Natural Atomic Orbitals (NAOs)
| Table of Coefficients and of % of each NAO used,
for each σ–MO |
|---|
| NAO: |
Atom 1 |
Atom 2 |
| O2s |
O2pz |
O2s |
O2pz |
| MO |
coeff. | % used |
coeff. | % used |
coeff. | % used |
coeff. | % used |
| σO(2s)O(2s) |
0.6843 | 47 |
-0.1680 | 3 |
0.6843 | 47 |
0.1680 | 3 |
| σ*O(2s)O(2s) |
0.6743 | 45 |
0.2083 | 4 |
-0.6743 | 45 |
0.2083 | 4 |
| σO(2p)O(2p) |
0.1700 | 3 |
0.6841 | 47 |
0.1700 | 3 |
-0.6841 | 47 |
| σ*O(2p)O(2p) |
-0.2074 | 4 |
0.6678 | 45 |
0.2074 | 4 |
0.6678 | 45 |
- The MO models shown on this web page were obtained at the
RMPW1PW91/6–311g(2df) level in a conventional ab initio calculation,
using a Gaussian atomic basis set
- The Gaussian atomic basis set is an approximation to Natural Atomic Orbitals, 2s,
2pz, etc., which are not very amenable to computation
- A Natural Bond Orbital analysis of the resulting MOs produced a set
of NAOs and the coefficients of these needed to make the calculated MOs
- The square of the coefficient, of a NAO in a MO, is the fraction of
the NAO used in that MO
- Most of these squares are shown
as percentages against the correlation lines of the Energy Level
Correlation Diagram
- All of the valence shell NAO contributions
to the σ–MOs are shown in the Table of Coefficients
- Expressed as percentages, all of the AO contributions to a MO should
add up to 100%, and all of the uses of an AO should sum to 100%, since
either an AO or a MO represents exactly one electron
- A rationalisation of the calculated coefficients for a homonuclear diatomic
species may be seen for N2
in a separate window. The same method could be used
for peroxide ion
Orthogonality of MOs
-
The σ orbitals (black in the Energy Level Diagram)
lie symmetrically across the
π nodes of the πx or πy orbitals
(red), so σ and π MOs do not mix
- Similarly, the πx MO lies symmetrically across
the π node of the πy MO and vice-versa, so
the π orbitals are orthogonal to each other and form a doubly degenerate
set
- In contrast, the nodal planes of the 2pz AOs do not
correspond to an element of symmetry of the molecule, so they do
mix with 2s AOs
- All four of the σ MOs contain both 2s and
2pz contributions from both atoms
The σ System and sp Mixing
- The extent of sp mixing depends upon the closeness in energy of the
2s and 2p NAOs
- They become further apart in energy with increasing effective nuclear charge,
e.g. in going from nitrogen to oxygen in the Periodic Table
- In the current NBO analysis for [O2]2–,
the 2s NAO was calculated to be
0.6814 H (18.543 eV) more stable
than 2pz, compared with 0.4603 H
(12.525 eV) for N2
- There is therefore much less sp mixing in
[O2]2– than in N2: the
σO(2s)O(2s) MO of peroxide ion contains 5.6% p
character, compared with 29% for N2, and the
σ*O(2s)O(2s) orbital contains 8.7% p
character compared with 38%
- Correspondingly, in peroxide there was 5.8% s character in
σO(2p)O(2p) compared with 30% for N2
- On
the corresponding web page for N2
the coefficients and percentage contributions of NAOs to MOs are presented
in the same form as the Table of Coefficients here for peroxide
| Table of Relative Contributions of
Overlaps to Bonding |
|---|
| MO |
Overlapping AOs |
Overlap integral S |
Contribution c1c2S |
Total for MO |
| Atom 1 | Atom 2 |
| σO(2s)O(2s) |
O2s |
O2s |
0.1830 |
0.0857 |
| σO(2s)O(2s) |
O2s |
O2pz |
0.3028 |
0.0348 |
| σO(2s)O(2s) |
O2pz |
O2s |
-0.3028 |
0.0348 |
| σO(2s)O(2s) |
O2pz |
O2pz |
-0.3045 |
0.0086 |
0.1639 |
| | | | |
| σ*O(2s)O(2s) |
O2s |
O2s |
0.1830 |
-0.0832 |
| σ*O(2s)O(2s) |
O2s |
O2pz |
0.3028 |
0.0425 |
| σ*O(2s)O(2s) |
O2pz |
O2s |
-0.3028 |
0.0425 |
| σ*O(2s)O(2s) |
O2pz |
O2pz |
-0.3045 |
-0.0132 |
-0.0114 |
| | | | |
| σO(2p)O(2p) |
O2s |
O2s |
0.1830 |
0.0053 |
| σO(2p)O(2p) |
O2s |
O2pz |
0.3028 |
-0.0352 |
| σO(2p)O(2p) |
O2pz |
O2s |
-0.3028 |
-0.0352 |
| σO(2p)O(2p) |
O2pz |
O2pz |
-0.3045 |
0.1425 |
0.0774 |
- For the three occupied σ orbitals, for each
of the four pairs of
O—O NAO overlaps, their contribution to bonding
c1c2S12 is shown in the Table of Relative Contributions of
Overlaps to Bonding.
S12 is the overlap integral between them calculated in the NBO
analysis and c1 and
c2 are their LCAO coefficients given in the first Table
- Although there is less sp mixing in peroxide, compared with N2, this
does not mean that it is unimportant here
- Because there is no net π bonding,
the optimum bond length is longer: it was
calculated for gas-phase peroxide ion in this study as 1.5838 Å,
compared with 1.0884 Å for N2
- The bond length in peroxide is now too long for
good 2s — 2s overlap,
but 2s — 2pz overlap is
less affected, and
2pz — 2pz
overlap is considerably stronger
- As shown in the Table of Relative Contributions of Overlaps to Bonding,
the pair of 2s — 2pz overlaps still
provide 42% of the bonding contribution of the σO(2s)O(2s)
MO, compared with 54% in N2
- The 2s — 2pz overlaps in
σ*O(2s)O(2s) are insufficient to make this
MO bonding as they do in N2, so it is net antibonding, as the
name used here implies
- Likewise, they are not antibonding enough in σO(2p)O(2p)
to prevent that MO from being bonding, in contrast to N2
- In peroxide ion, the bonding σO(2p)O(2p) orbital is calculated to
be below the π bonding orbitals in energy, as is the corresponding MO
in F2, whereas with antibonding character it appears above the π bonding levels in
N2
-
The idea that bonding by the σO(2s)O(2s)
orbital is cancelled out by antibonding by the
σ*O(2s)O(2s) orbital, leaving the
σO(2p)O(2p) orbital to contribute a bond order of 1,
is convenient and similar to arguments presented in some elementary textbooks,
but according to the present NBO study it is far from the 'truth'.
Because of sp mixing,
the σO(2s)O(2s) orbital here contributes 71.3% of
σ bonding (or total bonding), while σO(2p)O(2p)
contributes only 33.7%. σ*O(2s)O(2s)
has an antibonding effect of only -5.0%
π Bonding
- Because of the long bond, the overlap integral between 2py
orbitals on atoms 1 and 2 is 0.1709, compared with 0.4178 for N2
- The Contribution to Bonding of the πy orbital
of peroxide is 0.0854, compared with 0.2078 for N2,
where strong π bonding is the dominant feature of the MO description
and the equilibrium bond length is short so as to allow good π
overlap. (See the figures showing NAO overlaps in the π Bonding
section of
the N2 web page)
- However, the smallness of the π bonding contribution in peroxide
is of little concern because it is exactly cancelled out, to within the
precision quoted, by the antibonding contribution of the corresponding
filled π* orbital, and this would be so, whatever the
bond length. As chemists, we think of this situation as no π bonding
HOMO and LUMOs
- The HOMOs of peroxide ion are the
doubly degenerate pair of π* orbitals
- Attacking Lewis acids, e.g. H+, would be expected to
bond to opposite ends of these two orbitals, rationalising the known structure
of H2O2
- Removal of electron density from the antibonding π* HOMOs,
towards attached Lewis acid species, might be expected to strengthen and
shorten the O—O bond, just as donation of electron density into the
π* LUMOs of
CO is often given as an explanation of weakening of
the C—O bond during the formation of carbonyl complexes
- In fact, the O—O bond is shortened to about 1.499 Å in
Na2O2, when the theoretical Lewis acids are sodium
ions, and to 1.475 Å in H2O2 in the gas phase,
when they are protons
- The LUMO is the σ*O(2p)O(2p) orbital