ACE1037 Stock Markets & Foreign Exchange Markets
Contents:
1.
Stock Markets (markets for stocks of physical assets (land), and of financial assets (stocks and shares)) - Cleaver, chapters 7 & 9
2.
Forex markets - for foreign exchange. (Cleaver, Chapter 8)
1. Financial and Asset Markets (The Stock Market) - who
owns what bits of existing
capital.
The Stock Market: where already existing shares are swapped
between
people who want more (buyers) and people who want to hold fewer shares
(the sellers). The total stock of shares is pretty well fixed (aside
from
occasional new issues).
The land market, as an illustration: The total stock of land is Qf. Whatever the price, this
total
stock cannot be changed (aside from minor changes like draining lakes
etc.)
The sellers are signalling a negative demand for the thing
(land
in this case) - the offer curve (Oc) - the higher the price, the
greater the quantity we might expect present owners to be willing to
sell.
By the same token, all present owners who are
not selling are exhibiting
a positive demand for their stock given present prices. This
positve
demand is labelled the reservation demand (RD) in the
above
figure, which is the mirror image of the offer curve (Oc). What
is not being offered for sale by present owners is being retained (held
onto) - that is, it is being demanded.
The excess demand curve (XD) shows how much more
land present owners and non owners want to own at each price -
more
is demanded over and above present holdings of land as the
price
falls.
The horizontal sum of the reservation demand (RD) and
the excess demand (XD) is the total demand (TD)
for
land, or stock. It is the intersection of this total demand (TD)with
the fixed supply (Sf) which determines the market price for land
(Pe).
The trades we observe in a stock market are those between people who
no longer want to own the stock, for whatever reason, shown by the
offer
curve (Oc) and those who want to own more than they presently
have
(which might be some or none at all) - shown by the demand for
additional
stock (excess demand) labelled XD
above. Offer and XD intersect
at the trading price (Pe) and Qt of land (or stocks and shares) change
hands between buyers and sellers.
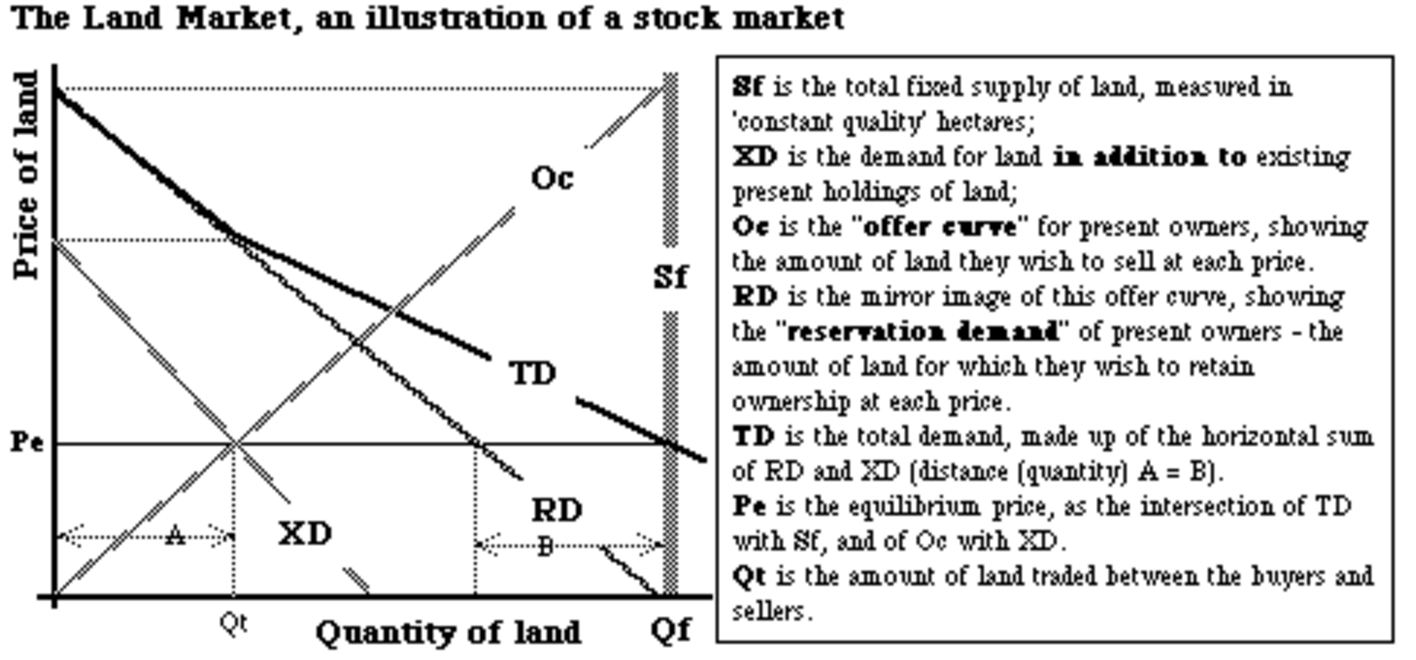
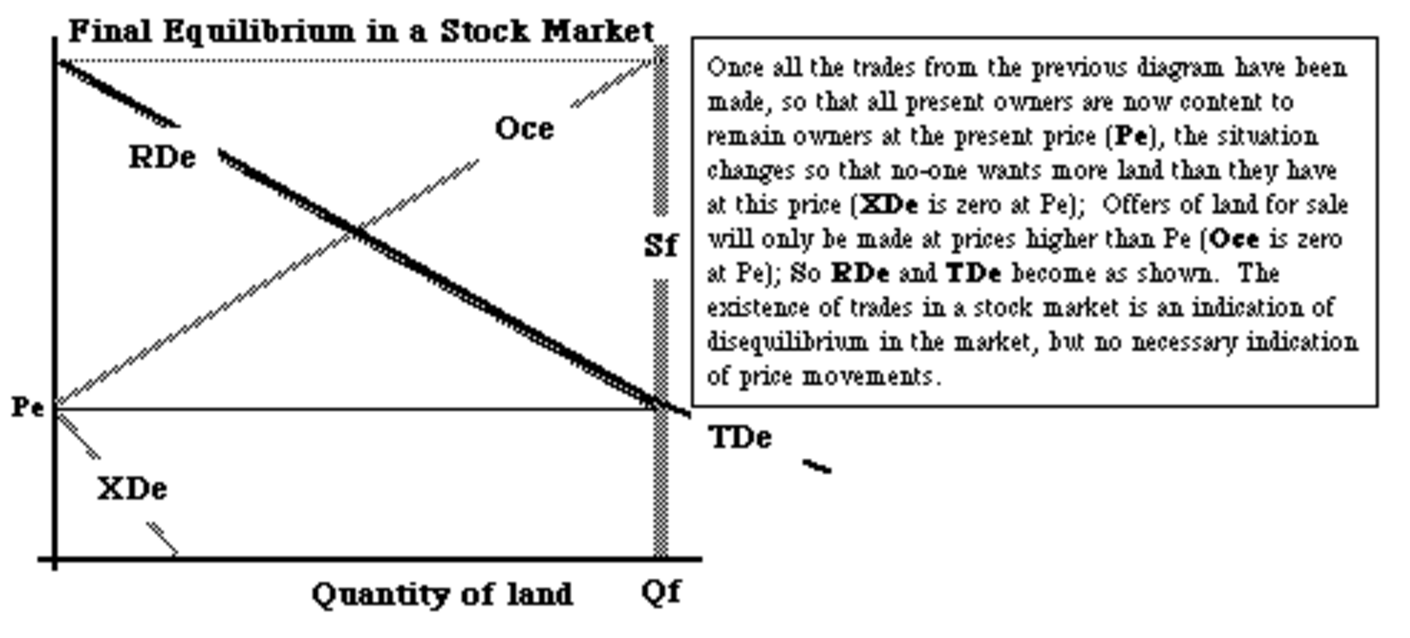
When all these trades have been made, the present owners are
now
willing to go on owning land at the present price, and are not willing
to sell any.
Share Prices and Stock Market price movements.
So, what is a stock or share (or piece of land) worth? The simple
answer first - it is worth whatever someone else will pay for it.
The current market price of the share, or piece of land, or any other
physical
asset, is as good an estimate of what it is worth as you can get.
The current price reflects the total demand (reservation and excess
demand)
matched with the fixed available supply. The price will change,
as
in all markets,
only if demand shifts or supply shifts. For land
and stock markets, the shifts in total supply are usually pretty
trivial
compared with the total stock. So it is shifts in demand which
are
critical in determining prices in these stock markets.
What will shift the demand curve for land (or stocks and shares) and
hence change their prices?
- expectations of future annual returns - if these expectations
increase,
then demand for the asset will increase - shift to the right, pushing
up
the asset price
- expectations of future selling price (market price) for the asset
- it
is expected to become more valuable in the future than it is now -
which
also pushes up the current market price
The two values are related because the market price can be interpreted
as the market buyers expectations of future earnings or returns.
- The market price of an asset (P) is the present value of
its expected
future earnings stream or yield, say R/yr, as anticipated by the
people trading the
asset
in the stock market.
- This present value discounts future earnings because:
- we have to wait to get them, and could simply put our money in
a bank savings account (or buy a government bond) - the risk-free rate
or return or
discount
rate (r)
- we need to cover the expected inflation rate in the future (p)
- we need a premium to cover the uncertainty (risk) associated
with this
future stream (u)
- The discount rate (or interest rate) i can thus
be
thought
of as being made up of three components: the real risk-free rate of
return
(r), the expected inflation rate (p) and the risk premium (u).
- For any perpetual asset - whose returns are expected
to
continue
indefinitely at some fixed value (R) - the Present Value = R/i
The key relationships can be illustrated through this perpetual asset:
PV
= R/i = Market Price of the asset:
- If the return is fixed (assumed to be known and given) at R, then
an
increase
in the price of the asset implies a lower rate of return (as a % annual
payment) - as asset prices increase, their internal rates of return
fall (other things being equal)
- If returns are expected to increase, then we would expect the
price of
the asset to increase, given the discount rate as the opportunity cost
of capital - the rate of return we can earn on other alternative assets.
- If the interest rate in the economy increases, then the
opportunity
cost
of capital increases, and asset prices will fall.
So, if a particular company discovers a new recipe for making profits,
its annual returns (R) will be expected to increase, and its share
price
will increase until the internal rate of return falls back in line with
the market rate of interest - given the risk and inflation element of
the
company. Conversely, if the company falls on hard times, because
its market is shrinking or because it is being badly managed, its
returns
will fall and its share price will fall as well, until the internal
rate
of return is once more in line with the market rate.
Suppose we do not expect rents to remain constant in the
future.
What might they do? They might be expected to increase (or fall)
by some average and constant amount each year (say plus or minus £A
per year). In this case, the relevant sum for the present value
of
this stream of future rents (annual returns) becomes:
PV = R/i + A/i2 , where R is the basic rent
or annual return (expected this year) and A is the amount by which we
expect
this annual return to change each year in the future, and i is the
discount
rate (the opportunity cost of capital - what we could earn elsewhere,
investing
in something else). So, if we expect returns to fall, the present
value is reduced compared with the simple sum which assumes the return
stays constant. But, if we expect returns to increase, then the
present
value increases, too.
Or, we might expect a continual percentage change in the annual
return,
say plus or minus g% per year. In this case, the PV sum
becomes:
PV = R/(i - g), so that, if the expected growth rate (g) in
the returns on this asset are higher than the opportunity cost of
capital
(i), the present value for this asset goes to infinity: there
is
no price it is not worth paying for such an asset - which is an
explanation
of why share prices shoot upwards for companies expected to do very
well
in the future.
Depreciating assets - ones that wear out.
So, how do we account for the fact that physical plant and equipment
wears out and becomes obsolete? By making an allowance for the
depreciation
of the asset - the continual re-investment necessary to maintain it in
a non-depreciating state. Suppose that this depreciation rate is
d%.
The gross return we need to get from this asset needs to cover this
depreciation
rate, so the net return we need to get on any depreciating asset is the
gross return minus the estimated depreciation rate. So, the gross
return we expect to get should be i = r + p + u + d on these
assets.
Implications
Cleaver (2013)
Understanding the World Economy, chapter 1, p 21ff. describes the
"Western Market Liberalisation" of the Thatcher & Reagan UK and US
governments in particular beginning in 1979 - which 'liberalised' the
financial and banking sectors on the presumption that markets know
best. For an update of the spectacular growth in the global
finacial sector since then, see a summary report of Deutsche Bank’s "Mapping the World's Financial Markets" (Sanjeev
Sanyal). Note, in particular, the substantial fluctuations in the
market value of these financial assets versus their book values (Figure
3), reflecting the major swings in 'market sentiment' about the
underlaying value of these assets. Stock markets are particularly prone to such swings in sentiment. (See, also, Five charts that explain the world's wealth distribution.)
We should not necessarily be surprised that the value of global
financial assets is 3 to 5 times as great as world GDP (Figure 2 of the
Mapping link). In essence, this is the current market valuation of the
stock of productive capital in the world, which shoud be able to
produce future flows of income and GDP. What is more worrying is that
the continual search for profit in these finacial markets encourages
the development of 'derivatives' as a new supply of paper assets
apparently related to underlying productive or valuable assets, but in
practice substantially divorced from the underlying productive assets.
As Warren Buffet famously remarked - they may well be 'weapons of mass destruction'.
In particular, OTC derivatives contracts (over the counter, as opposed
to those exhanged through organised exchanges) have grown substantially
since financial deregulation in the late 1970s. Their importance is
outlined here (by the Milken Institute), and documented by the Bank for International Settlements.
Hyman Minsky's “financial-instability hypothesis”
- investment (in new plant, equipment etc.) is "in essence, an exchange
of money today for money tomorrow ..money today can come from one of
two sources: the firm’s own cash or that of others (for example, if the
firm borrows from a bank). The balance between the two is the key
question for the financial system. Minsky distinguished between three
kinds of financing.
The first, which he called “hedge financing”,
is the safest: firms rely on their future cashflow to repay all their
borrowings. For this to work, they need to have very limited borrowings
and healthy profits.
The second, speculative financing,
is a bit riskier: firms rely on their cashflow to repay the interest on
their borrowings but must roll over their debt to repay the principal.
This should be manageable as long as the economy functions smoothly,
but a downturn could cause distress. [this, essentially, is the
principle behind joint-stock public companies and their share
certificates]
The third, Ponzi financing, is
the most dangerous. Cashflow covers neither principal nor interest;
firms are betting only that the underlying asset will appreciate by
enough to cover their liabilities. If that fails to happen, they will
be left exposed."
"Economies dominated by hedge financing—that is, those with strong cashflows and low debt levels—are the most stable.
When speculative and, especially, Ponzi financing come to the fore,
financial systems are more vulnerable. If asset values start to fall,
either because of monetary tightening or some external shock, the most
overstretched firms will be forced to sell their positions. This
further undermines asset values, causing pain for even more firms. They
could avoid this trouble by restricting themselves to hedge financing.
But over time, particularly
when the economy is in fine fettle, the temptation to take on debt is
irresistible. When growth looks assured, why not borrow more? Banks add
to the dynamic, lowering their credit standards the longer booms last.
If defaults are minimal, why not lend more? Minsky’s conclusion was
unsettling. Economic stability breeds instability. Periods of
prosperity give way to financial fragility."
2. Macroeconomics
&
International Trade: The FOREX market.
What, if anything, balances Imports with Exports in the
CFoI?
The Foreign Exchange (Forex) market - where people and
businesses
trade one currency for another - as recorded in the Balance of Payments.(Pink Book) recording the international transactions (across the (forex) exchanges).
- Demand for sterling (= supply of forex) depends on exports
of goods and services, and on inward flows of investment funds from
abroad
(capital inflows)
- Supply of sterling (= demand for forex) depends on imports
of goods and services, and on outward flows of investment funds from
the
UK to foreign countries (capital outflows)
- Balance of Payments (BoP) records all these transactions:
- Current Account (Exports vs. Imports)
- balance of visible trade
- balance of invisible trade (services, tourism travel etc.)
- Capital Account (flows of investment (financial) funds
into and
out of the country
- Official Financing - change in the Central Bank (BoE in the UK)
forex reserves.
e.g. 1996 UK situation:
(for recent data on exports, imports, and capital flows, see the ONS balance of payments data,
table B, current account, and table I, capital account. 2015 Exports of
goods and services: £517.4bn, Imports of goods and services: £547.2bn,
Other current inflows £153.6bn, other current outflows £204bn. -> current account balance: £-80.2bn. 2015 Capital inflows (net) £1.53bn, Outflows: £2.64bn, Capital balance: £-1.11bn. The financial account (Table A)
shows how the overall Balance of Payments (£-81.3bn) was financed,
through a range of 'official' (BoE) transactions, including, as a minor
element, changes in forex reserves).
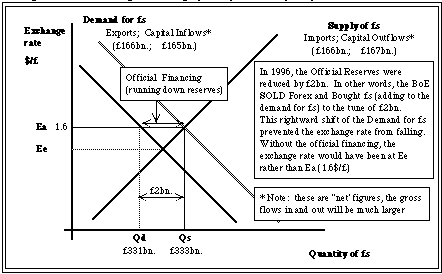
Demand
: Ceteris paribus, exports and capital inflows will be
greater
the lower the exchange rate - demand curve slopes downwards.
Supply : ceteris paribus, will be greater the higher
is the exchange rate - the supply curve slopes upwards.
Equilibrium exchange rate balances exports plus capital inflows
with imports plus capital outflows.
Exchange rate managed by Central Bank (BoE) control of Forex
reserves, and
also through borrowing (repaying) loans from foreign banks.
Dforex and Sforex are also affected by Incomes (Y) and Interest rates
- Increasing Income shifts Sf right (increasing demand for imports)
->
e.r.
depreciation or BoP deficit (the typical UK condition prior to 1971 -
when under fixed exchange rates)
- Increasing Interest rates shift Sf left (discouraging capital
outflows),
and Df right (encouraging capital inflows -> e.r. appreciation or
BoP surplus (the typical German condition prior to 1971 under fixed
exchange rates)
Monetary Policy more powerful under floating exchange rates than
fixed:
Expansionary monetary policy:
- Increases Y
- Reduces r
- depreciates e.r -> more expensive imports, more competitive
exports
->
further expansionary effect.
- more likely to generate inflation
Under fixed exchange rates,
domestic expansion tends to increase imports faster than exports,
opening up a trade deficit. If this deficit is not counter-balanced by
a tight monetary policy (higher interest rates), then the BoP deficit
tends to get worse - and can only be financed by running down forex
reserves (or increased borrowing from abroad by the Central
Bank). The cure is then contraction of the domestic economy,
tight fiscal and monetary policy, or devluation - which will tend to
lead to inflation.
Purchasing Power Parity:
this theory is derived from the fact that, in the long run, we would
expect the exchange rate to adjust to actual trade flows, rather than
to capital flows, since the latter should ultimately reflect the
international competitiveness of the economy. If trade were all
one way (all imports, for instance, and no exports) then the exchange
rate would depreciate, since more people would be trying to sell
the currency than trying to buy it. On the other hand, if trade
were all exports and no imports, then the exchange rate would be
expected to appreciate. When in balance, imports will equal
exports, and the exchange rate will be stable. What this means is
that exchange rates will tend to adjust (in the long run) so that the
prices of tradable goods are the same in all countries in the trading
world - so there is no incentive to buy in one place and sell in
another. So long as there is no other intervention (taxes or subsidies
etc.) in the domestic markets, then prices will be the same
valued at the so-called purchasing power parity
rates. The Economist
regularly approximates these rates by calculating the exchange rates
which would have to hold if the price of a Big Mac hamburger were to be
same the world over (assuming that Big Mac hamburgers are essentially
tradable). See here for the results of this calculation, and the explanation. The World Bank has data for the PPP conversion factor
(local currency per $) for conversion of national GDP to $ at the PPP
rate, rather then the market rate. This table, for the UK, shows that
the Sterling ppp rate has been constant at 0.7 (i.e. $1.428 per £)
since 2000 (2016 data not yet available)
NOTE:
the
capital account can be much larger than the current (trade)
account. Capital inflows and outflows can dominate export and import flows,
so the exchange rate is typically very sensitive to capital movements,
especially short term capital flows (unless these are
controlled). This can cause serious short term problems:
- Any currency which is viewed by the market as being vulnerable is
subject to considerable short term capital outflows, which makes the
currency even more vulnerable and liable to devaluation of fixed rate
or depreciation of a floating rate. Speculative bubbles (either bull or
bear) are frequent in the Forex market, especially but not only for the
lesser currencies (can even affect the major currencies - euro, $, yen,
£)
- rapid growth from Foreign Direct Investment (FDI) - direct,
because it refers to actual purchases of goods and services and
physical investment) tends to lead
to currency appreciation as a result of the capital inflows, as does an
increase in the price of raw materials and fuels, for net exporters of
these goods (sometimes
called the Dutch disease, after the experience of the Netherlands
when North Sea Oil was first discovered and exploited). This e.r
appreciation puts major pressure on the domestic economy - making
imports more competitive and exports more difficult to sell, tending to
contract the domestic economy. The domestic economy needs to be both
robust and flexible (sensible banks and stock markets) to cope with
this pressure.
The history of the Sterling exchange rate
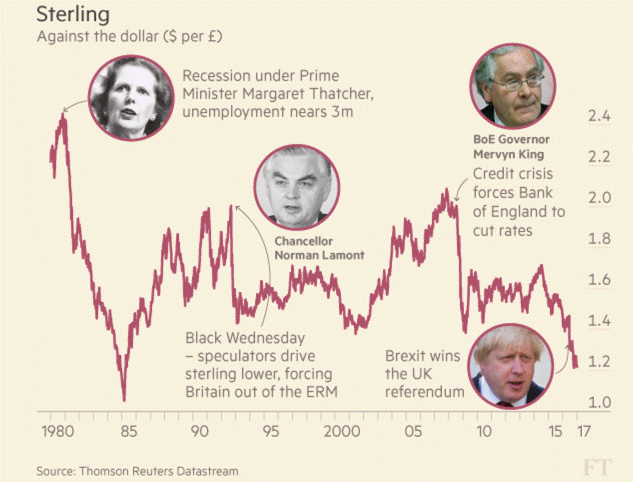
Source: FT, 16.01.17: "What next for FTSE 100 after record breaking run?",
Michael Hunter, who comments that the FTSE's recent record breaking run
(Dec. '16 - Jan '17) has only begun to catch up with the stronger
performance of the index's global rivals since 2000. It is now barely
above its dotcom peak (1999/2000) and has underperformed against the
S&P500 (New York) since the millenium peak.
https://www.ft.com/content/3879a70a-d732-11e6-944b-e7eb37a6aa8e?segmentId=778a3b31-0eac-c57a-a529-d296f5da8125
The (Macro Economic) Policy Trilemma:
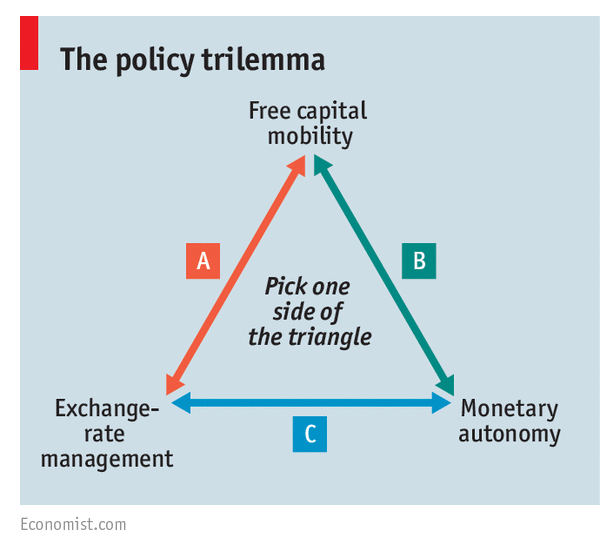 "Where barriers to capital flow are undesirable or futile, the trilemma boils down to a choice: between a floating exchange rate and control of monetary policy; or a fixed exchange rate and monetary bondage.
Rich countries have typically chosen the former, but the countries that
have adopted the euro have embraced the latter. The sacrifice of
monetary-policy autonomy that the single currency entailed was plain
even before its launch in 1999."
"Building on his earlier research, Mr Mundell showed in a paper in 1963 that monetary policy becomes ineffective where there is full capital mobility and a fixed exchange rate. Fleming’s paper had a similar result."
"If the world of economics remained unshaken, it was because capital
flows were small at the time (1960s). Rich-world currencies were pegged
to the dollar under a system of fixed exchange rates agreed at Bretton
Woods, New Hampshire, in 1944. It was only after this arrangement broke down in the 1970s that the trilemma gained great policy relevance."
"Keynes was acutely aware of it .. and ..believed a system of
fixed exchange rates was beneficial for trade. .. he proposed an
alternative scheme, which became the basis of Britain’s negotiating
position at Bretton Woods. An international clearing bank (ICB) would
settle the balance of transactions that gave rise to trade surpluses or
deficits. Each country in the scheme would have an overdraft facility
at the ICB, proportionate to its trade. This would afford deficit
countries a buffer against the painful adjustments required under the
gold standard. There would be penalties for overly lax countries:
overdrafts would incur interest on a rising scale, for instance.
Keynes’s scheme would also penalise countries for hoarding by taxing
big surpluses. Keynes could not secure support for such “creditor
adjustment”. America opposed the idea for the same reason Germany
resists it today: it was a country with a big surplus on its balance of
trade. But his proposal for an international clearing bank with
overdraft facilities did lay the ground for the IMF" (and its system of
special drawing rights)
"What is clear [from Ms Rey’s work] is
that the power of global capital flows means the autonomy of a country
with a floating currency is far more limited (even) than the trilemma
implies."
Return to Course Index


 "Where barriers to capital flow are undesirable or futile, the trilemma boils down to a choice: between a floating exchange rate and control of monetary policy; or a fixed exchange rate and monetary bondage.
Rich countries have typically chosen the former, but the countries that
have adopted the euro have embraced the latter. The sacrifice of
monetary-policy autonomy that the single currency entailed was plain
even before its launch in 1999."