ACE 2006: Agricultural Economics.


The New Zealand Experience.

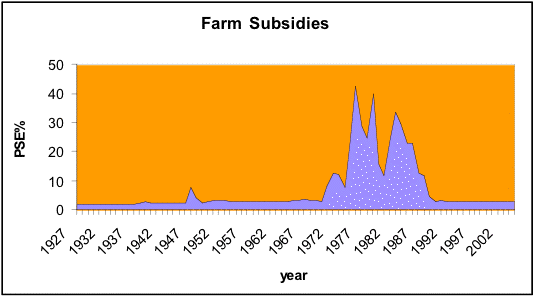
New Zealand's subsidy history is shown in Figure 1 (from Farm Subsidy Reform Dividends, Ralph Lattimore, 2006)

[Producer Subsidy Equivalent (PSE) is now defined and calculated by the OECD, and reported regularly for all OECD countries, as well as some others, and is now called the Producer Support Estimate.
It's definition is as follows:  "an indicator of the annual monetary value of gross transfers from consumers and taxpayers to agricultural producers, measured at the farm gate level, arising from policy measures that support agriculture, regardless of their nature, objectives or impacts on farm production or income. It includes market price support and budgetary payments, i.e. gross transfers from taxpayers to agricultural producers arising from policy measures based on: current output, area planted/animal numbers, historical entitlements, input use, input constraints, and overall farming income. The %PSE measures the transfers as a share of gross farm receipts." (OECD, PSE site (EU) which details the current estimates and history for the EU, and also the full data base for the PSE estimates)

So, the subsidy value of (e.g.) import taxes is estimated as the difference between the internal domestic market price and a world reference price (as the estimate of the relevant world price at the border). The value of this import tax to the domestic producer is then this subsidy equivalent per unit times the import volume.  This estimate can then be added to any 'direct' subsidy, such as deficiency payments or single farm payments, to provide an overall subsidy equivalent. The % figure reported above is the total PSE estimate expressed as a proportion of the value of farm output.  The need for such a measure arises from the fact of the wide variety of different instruments used to support agriculture, and the requirement to aggregate (add up) these different measures to obtain an overall estimate of the levels of support]

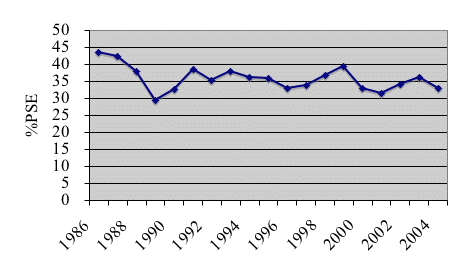
For recent comparison, Figure 2 shows the PSE for the EU (12 members to 1994, 15 thereafter)

New Zealand was tempted down the agricultural subsidy and protection route in the early 1970s, partly in an attempt to counteract the anticipated adverse effects of the UK's entry to the EU.  Most of the subsidies were of the deficiency payment type, and were paid largely to beef, sheep and dairy producers (rather than to intensive livestock and horticulture). There were also some substantial input subsidies. These subsidies were also intended to compensate a major exporting sector for the extra costs caused by NZ's import tariffs and controls (which increased farming's input costs).

As Lattimore (op. cit) says. "By 1984, there were severe macroeconomic imbalances. High levels of government foreign borrowing had resulted in credit rating downgrades and attempts were being made to offset the large twin deficits (budget and trade) with price, wage and interest rate controls. The rate of economic growth was poor and underlying inflation was still around 20% per year.
Within agriculture, high sheep subsidies had led to unsaleable surpluses of sheepmeat, farm development on very marginal land, food quality problems arising from import controls and concern over the lack of agricultural diversification and the lack of product development for both the domestic and export markets. The US Government added its stimulus by complaining about New Zealand agricultural subsidies and threatening countervailing action on exports."

Finally, a foreign exchange crisis in 1984 (associated with large budget and trade deficits) coincided with a general election, which the opposition (Labour) won in a landslide.  The incoming government, especially its Finance Minister, was convinced of the advantages of de-regulation and the free market, and engineered what was, essentially, a Thatcherite/Reaganite reform, removing import controls and reducing tariffs, and reducing/eliminating farm subsidies (which commercial farmers were able to accept, with only very limited compensation, on the grounds that the economic reforms would also reduce farm costs).

The immediate effects of this rapid removal of support were
  • immediate fall in real incomes (sheep down 60%, dairy 25%, 86/85)
  • Land prices down 65% at trough (1987)
  • Fertiliser use down 50% (85/87)
  • Farm diversification, debt re-structuring, hired labour reduction, with large areas of marginal land taken out of production
  • Farm GDP continued to fall (as it had before the reforms), from 13.9% in 1966 to a low of 5.7% in 1987.
Longer term consequences:
  • Ag share of GDP actually growing (based on export market growth) to 7.6% in 2002.
  • farm numbers (commercial farms) actually grew from 77k in '84 to approx. 80k over 86 - 93
  • labour productivity grown by 85% since 1984.
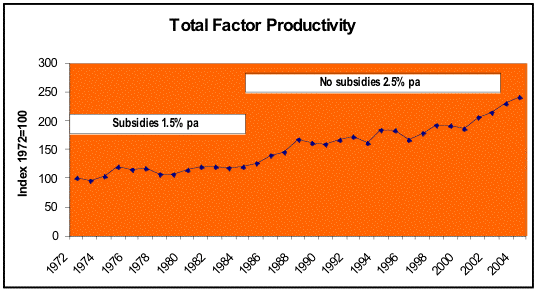
  • Total factor productivity (value-added per unit use of all factors (land, labour, management and capital combined)) shown below, where it is measured as the ratio of value-added in farming to an index of primary factor inputs,  which has grown by an additional 1%/year since the removal of subsidies.
Again, Lattimore (op cit.) says: "The winners in agriculture from the economic reforms are those farmers (the majority) who withstood the short-term adjustment costs and stayed in farming long enough for farm incomes and farmland prices to recover. They won in large part because they developed and adopted new technology to boost farm productivity.  This is best indicated by the acceleration in total factor productivity (TFP)

Lattimore goes on:  "Some perspective on these TFP growth rates may be gained by considering that at a TFP growth rate of 1.5% pa, it would take nearly two generations to double a farmers income but at 2.5%, it would only take 1 generation.

The losers were those farmers who left or were forced out of the industry while farmland prices remained low. There were some farmer suicides and there was a high incidence of personal and social anxiety in rural areas. Farm employees who were laid off had to find alternative employment, often in other regions.

Government overestimated the number of farms that would be declared bankrupt or otherwise forced off their farms. During the reforms, government forecast that around 20% of farmers would lose their farms. In the event, only about 1% of farmers took exit packages and about 5% of farmers left the land over the period 1985-89. These numbers are not significantly greater than the normal rate of farm bankruptcies."

This final point illustrates the well-known adage:  "borrow £10,000 from the bank and you can't pay it back, you have a problem - borrow £10,000 million and you can't pay it back, the bank has a problem".  NZ Banks carried a substantial portfolio of farm debt, and could not afford to declare it a 'write-off', especially as the immediate response to  the reduction/elimination of  subsidy was a substantial devaluation of the farm assets (including land), which, In NZ's case was also exacerbated by high interest rates (as a cure for the rapid inflation of 20% or so at the time of the reforms). Instead, the banks took the commercially prudent course of restructuring (re-organising) farm debts (to longer payback periods, for instance, with smaller annual service payments), to tide viable farms (most of them) over the short term upheaval until they returned to profitability.   Incidentally, this form of indirect assistance to farmers (financed by the bank shareholders) is of little use to those farms at the stage in their life cycles when they are largely free of debt, but I have no information on this for NZ.

In addition, as Lattimore points out: "The overall New Zealand economic reform programme was technically inefficient in the sense that it imposed unnecessary cost on farmers. Net farm incomes and farmland prices did not have to fall as much as they did in the short-term. Unfortunately, for farmers, New Zealand policy generally was in crisis and the timing and sequencing of the reforms was dictated by political realities rather than good planning.  Where reforming countries already have a reasonably stable macroeconomic environment, farm subsidy removal would be much less painful that it was in New Zealand."  These reforms were carried out during a period when the NZ economy was recovering from a particularly difficult period of high inflation, and chronic BoP and budget deficits.  Under more (hopefully) normal conditions, the transition to free(r) trade would be much easier.

Conclusion

In short, removal of subsidy need not spell the end of an agricultural industry - rather the reverse, as the NZ experience demonstrates. Of course, NZ agriculture has a comparative advantage - it is generally recognised to be the world leader, especially in sheep and dairy production, because the islands' natural and human resources and climate are especially well suited to the production of these products, compared with both what else they themselves might produce, and (much less importantly) compared with other parts of the world. But, compared with large parts of the UK? Which has very similar natural and human resources, and climate, and, as an additional major advantage, is much closer to its markets??  Why would the UK experience, in the (very unlikely) event that farm subsidies were withdrawn, be any different to the NZ experience?

Now we need to go back to basics and re-consider the case for free trade and markets rather than government policy, and the nature of competition, which provides the basis for analysing policy intervention and estimating the costs and benefits of reform.


Back to ACE 2006 Index