MACROECONOMIC PRINCIPLES
CONTENTS:
- Macroeconomic Basics - the Circular Flow of Income
(CFoI),
with Government and Fiscal Policy
- Money, Capital and Stock (Financial) Markets
- Macroeconomics
of
Money with the CFoI( IS/LM)
- Macroeconomics of
International Trade (Forex Markets)
- MacroEconomic
Management
1. Macroeconomic
Basics
- the Circular Flow of Income (CFoI) - also applies to regional
economies.
Simplify the whole economy as an interaction between Consumers
(households),
Producers (firms), and Government. NOTE: This is a
circular
flow of INCOME (and spending) - although measured and identified in
money
terms, it is the livings (income and spending) - the real
purchasing
power of the money - which is important here. Always refer to the
flow as an INCOME flow and not a flow of money.
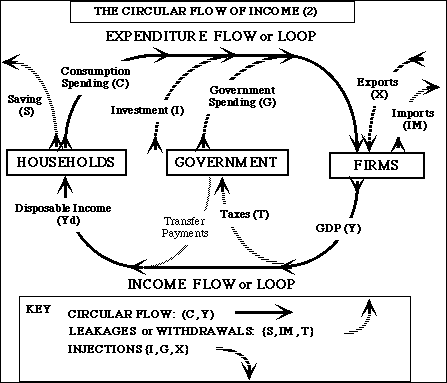
- Consumption (C) is spending on goods and services for
final
use
(consumption) during this period.
- Investment (I) - an injection into the
CFoI -
is the
purchase of actual physical
capital (equipment etc.), or the
improvement
of peoples skills and expertise - final spending on things which are
intended
to increase income levels in future periods rather than this
one.
[Please Note: Firms are responsible for most of this investment,
not governments, though some government spending is investment for
future
periods rather than spending on current (this year's) goods and
services]
- Saving (S) is just
and only income which is NOT spent on
final goods
and services. (= Yd - C) - a withdrawal from the CFoI. [Please
Note: Investment spending is matched with Savings through the
financial
and money markets (see below), which are separate from this
Circular Flow of INCOME picture of the economy]
- Government Spending (G) is ONLY spending on final goods
and
services
(wages and salaries, paper, power, building maintenance and improvement
etc.) used up in this period or intended for use in future periods
(includes
any government investment) - an injection into the CFoI
- The other (major) part of total government expenditure is Transfer
Payments:
social security, unemployment benefit, public (national) pension
payments
etc. which simply add directly to the recipients incomes, and
which
are not paid in return for actual services.
- Taxes (T)are the government reciepts - actually also
raised
on
the
spending loop (VAT, excise duties), as well as on income streams
(income
and corporation taxes) - T is best thought of as total taxes
minus
transfer payments - a withdrawal from the CFoI
- Exports (X) of goods and services provide income for
firms,
and
also
measure this part of total output of the economy - an injection
into the CFoI
- Imports (IM) of goods and services leak income out of
the
national (domestic)
flow of income - a withdrawal from the CFoI
- Total Expenditure equals Output (C + I + G + X - IM) equals
Income
(called
Gross Domestic Product) (Y) which equals Disposable Income (Yd) plus
Taxes.
NOTE: Necessary Accounting equality (Total Expenditure =
Income)
over any one period (one year) does not necessarily imply equilibrium.
If Expenditure is growing, then so too will income - and both will be
larger
in the next period. If income is falling, then spending will also
fall, and both will be smaller next period.
Equilibrium Process of the CFoI.
- Increasing Injections (G, I, X) and/or reductions
in Withdrawals (T, S, IM) will increase the CFoI
(increasing
income and output (expenditures) and vice versa.
- Multiplier process - increasing an injection (for
instance)
increases
income, which then leads to further increases in spending and resulting
income: an initial increase
in
spending(say by government) generates an equivalent increase in income,
which then in turn generates a second round increase in spending
(though of a smaller amount, since some of the increase in income will
be saved), and so on . This MULTIPLIER process comes to a halt when the
increased initial injection has generated sufficient increases in the
withdrawls (leakages) for the system to return to balance.
- until income levels have risen sufficiently that new
levels
of withdrawals
equal the new level of injections (increasing incomes tend to lead to
increased
savings, taxes and imports). Y (GDP) will not be in
equilibrium until
resulting Withdrawals balance Injections. Equilibrium is
established when Injections are equal to Withdrawls (G+I+X) = (T+S+IM)
Note: This picture is
STATIC. In practice, economies tend to grow (as more capital is
invested (built and commisioned) and as people get better atdoing what
they do. Trend growth (improvement in technology and productivity
(outputs
per
unit
inputs)) typically about 2.5 - 3.5% per year for developed countries,
and may well be substantially higher for well managed developing
countries (8 - 10% or more for China, for instance)
The balances between injections and withdrawls here are better thought
of as cyclical growth (or decline) round the trend growth - booms
(strongly
positive
growth rates) and recessions (slower growth rates) or depressions
(negative
growth rates).
Fiscal Policy as a stabiliser of economic cycles:
- Government Fiscal Policy (the balance between G and T) can
influence
equilibrium
Income levels
- Increase G (or reduce T) to counteract a recession
- Reduce G (or increase T) to counteract an unsustainable boom
(income
growth
exceeding full capacity of the economy, which leads to inflation - see
below)
Capacity Limits:
- Total Capacity of the economy to generate output and income
depends on
the quantities of land, labour, management and capital plant and
equipment
available
- When all of these factors of production are fully employed, the
economy
is operating at full capacity (i.e on its PPF from the previous
session). Otherwise, there is unemployment -
the economy could produce more income and output, if people were not
unemployed when they are actually looking for work.
- Capacity can be increased by:
- investment in capital plant and
equipment - more
capital for production and output;
- increase in the labour force
participating in
the economy - more employment -> more output & income;
- improvement in technology - more
output &
income from the same amounts of labour and capital through
technological
improvement - better quality and more productive capital;
- improved productivity of labour -
better skilled
and better organised labour increasing the amounts that can be produced
and the income that can be earned;
- structural change- re-organisation
of
resources
among different firms with lower costs, improving management.
- Fiscal Policy (G and T) can affect these
capacity increasing
processes - so should be used with care and caution.
Back to Contents.
2. Money, Capital
and Stock (Financial) Markets.
Money and CFoI (and Inflation)
- National Income (GDP) = P x Y
(a
grand sum of millions of price times quantity trades) -
where Y
is real income - in terms of purchasing power over all goods
and
services, and P is the general price level (an index of all
prices
in the economy)
- Money (M) is the medium through which
these trades
take place (notes, coins, and current accounts with banks)
- Money is a STOCK which is exchanged between
different
people and businesses as trades happen
- The FLOW of money round the CFoI is given by
M
x V, where V is the Velocity of Circulation - the number of
times
any one £ changes hands in the course of 1 year.
- MV = PY (the Quantity
equation of
exchange)
always holds - it is the only way of defining and measuring V.
- If V is constant, then PY (nominal or
current
GDP, national
income) can only increase if M increases.
- If Y is fixed by the Capacity Constraint -
at Yf
(full
employment national income), then any increase in MV will lead to an
increase
in P -> inflation.
The Market for Money
Money is used both as a medium
of exchange for transactions (active
bank
balances) and also as a store of wealth (idle bank balances).
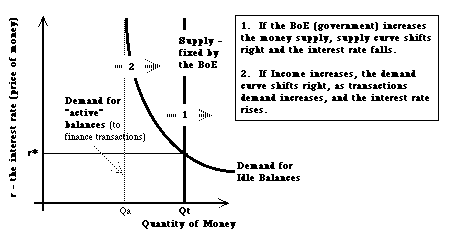 Demand
for and Supply of Money: The price of money is the interest
rate, what it costs to get more of it, and the opportunity cost
of holding money, rather than converting it into interest bearing
assets (stocks and shares, savings accounts etc.)
- Demand for money (current account bank balances) depends on:
- Income (especially for transactions or active balances)
- Price (the interest rate) especially for idle balances - the
higher the
interest rate, the greater the opportunity cost of holding wealth as
money
rather than as financial or physical assets.
- Money Supply is controlled by the Monetary Authority - Central
Bank, the Bank
of
England
(BoE) in the UK
- Monetary Policy is decided by the Monetary Policy Committe of the
BoE,
with the objectve of controlling inflation
- either through controlling the Supply of Money directly (which
proves
to
be rather difficult)
- or by setting the base lending (interest) rate of the Bank of
England
to
the commercial banking system - the current system of Monetary policy.
(Setting the interest rate at a new level above r* will automatically
result
in a contraction of the supply of money to match the reduced demand -
since
the BoE, through its function as lender of last resort, implicitly sets
the
supply of money to match its ruling interest rate)
Capital Markets: Balance between Savings and Investment (in new
plant
and equipment etc.)
The rate of interest also influences Savings and Investment - the
balance
in the capital market for loanable (investment) funds
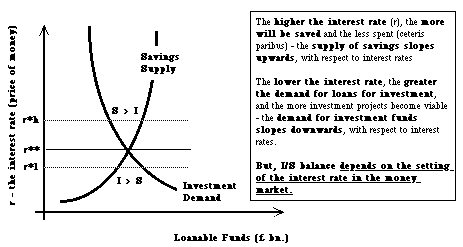 Notice:
If the interest rate (set in the money market) results in I > S,
then there
will be a tendency for the level of National Income (Y) to grow -
increasing
savings (shifting this ceteris paribus Savings supply curve
shifts
to the right as incomes increase) to match the additional
investment.
However, increasing Y might also increase Imports and Taxes - so that
the
imbalance between savings and investment might persist - offset by
imbalances
between G and T, and between IM and X.
Financial and Asset (Stock) Markets - who owns what bits of
existing
capital.
These are
Stock Markets: where a more or
less fixed stock of existing shares are swapped
between
people who want more (buyers) and people who want to hold fewer shares
(the sellers). The total stock of shares is pretty well fixed (aside
from
occasional new issues). Their price (market value) is completey
determined by the demand against a fixed (vertical) supply - see here for more discussion of the
implications.
The critical outcome of these markets is the market valuation of the
stocks (shares) in both the commercial sector and the government
(through the valuation of government stocks and bonds). In each case,
these stocks, shares and bonds are simply certificates which promise to
pay the owner either a fixed amount (yield) annually [for a bond]
or a
share of the distributed profits (dividend) if any - usually once every
six months. The value of these bits of paper is, therefore, the
discounted sum of the expected future stream of annual yields or future
dividends, plus the expected future changes in the market value of
these bits of paper (the 'capital' gains or losses.
The key relationship is that
as interest rates increase, so the market value of these paper assets
tends to decrease, and vice
versa, because the discount rate (the opportunity cost of money,
as the interest rate) is higher (lower).
Back to Contents.
3. Macroeconomics
of
Money with the CFoI( IS/LM)
Management of the Macroeconomy depends on achieving an appropriate
balance
between the markets for goods and services (as represented by the CFoI)
and the money markets (as above).
It therefore depends on achieving an appropriate balance between the
two major levers of
macroeconomic management: Fiscal
Policy and
Monetary
Policy.
The Key variables in this balance are the level of national income
(Y) and the rate of interest (r) - charted on the IS/LM diagram:
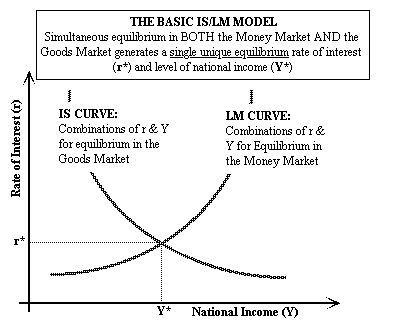 The IS
curve
refers to the equilibrium levels of National Income in the markets
for
goods and services (CFoI). Here, higher rates of interest are
associated with lower levels of spending (higher savings, lower
investment,
lower levels of consumption) - so the IS curve slopes downwards. Note
the direction of causation: setting the interest rate determines
savings (withdrawals) and investment (injections), which then
determines
the equilibrium level of national income.
The LM curve refers to the equilibrium in the Money Markets
-
given
a fixed money supply. Here, higher levels of national income lead
to
greater demand for money (for transactions), and hence higher rates of
interest (given a fixed money supply)- so the LM curve slopes upwards.
Note the direction of causation (opposite from IS curve) -
incomes
drive the demand for money, which then sets the interest rate if the
supply
of money is fixed (or sets the supply of money if the interest rate is
fixed)
Fiscal Policy affects the IS curve - expansionary
(increase
G, reduce T) shifts IS right, and vice versa.
Monetary Policy affects the LM curve - expansionary
(increasing
Ms, reducing interest rates) shifts LM right, and vice versa.
The relative effectiveness of Monetary and Fiscal Policies in
influencing
Y (and thus employment) depends, therefore, on the slopes of the IS and
LM curves.
The steeper the LM curve, the greater the "crowding out" effect
of government spending - G increases increase interest rates which
reduce
(crowd out) private spending.
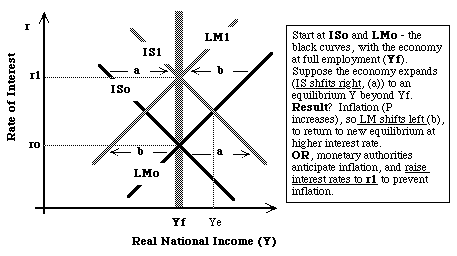
Inflation effects - If equilibrium Y* is greater than the full
capacity of the economy - there will be pressure on prices - leading to
inflation. Inflation reduces the value of the fixed Money
Supply,
shifting LM left, raising interest rates and reducing Y* back
towards
its full capacity level.
BoE MPC raising interest rates to limit inflation is the practical
counterpart of this effect - by rasing interest rates, the MPC
effectively
holds the Money Supply constant in the face of increasing demand, and
actively shifts the LM curve to the left if the economy threatens to
become inflationary.
Back
to Contents.
4. Macroeconomics of
International Trade
What, if anything, balances Imports with Exports in the
CFoI?
The Foreign Exchange (Forex) market - where people and
businesses
trade one currency for another.
- Demand for sterling (= supply of forex) depends on exports
of goods and services, and on inward flows of investment funds from
abroad
(capital inflows)
- Supply of sterling (= demand for forex) depends on imports
of goods and services, and on outward flows of investment funds from
the
UK to foreign countries (capital outflows)
- Balance of Payments (BoP) records all these transactions:
- Current Account (Exports vs. Imports)
- balance of visible trade
- balance of invisible trade (services, tourism travel etc.)
- Capital Account (flows of investment (financial) funds
into and
out of the country
- Official Financing - change in the Central Bank (BoE in the UK)
forex reserves.
The 1996 UK situation:
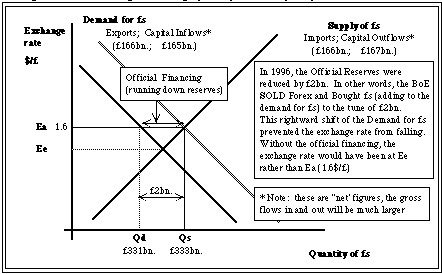 Demand
: Ceteris paribus, exports and capital inflows will be
greater
the lower the exchange rate - demand curve slopes downwards.
Supply : ceteris paribus, will be greater the higher
is the exchange rate - the supply curve slopes upwards.
Equilibrium exchange rate balances exports plus capital inflows
with imports plus capital outflows.
Exchange rate managed by Central Bank (BoE) control of Forex
reserves, and
also through borrowing (repaying) loans from foreign banks.
Dforex and Sforex are also affected by Incomes (Y) and Interest rates
- Increasing Income shifts Sf right (increasing demand for imports)
->
e.r.
depreciation or BoP deficit
- Increasing Interest rates shift Sf left (discouraging capital
outflows),
and Df right (encouraging capital inflows -> e.r. appreciation or
BoP surplus
Monetary Policy more powerful under floating exchange rates than
fixed:
Expansionary monetary policy:
- Increases Y
- Reduces r
- depreciates e.r -> more expensive imports, more competitive
exports
->
further expansionary effect.
- more likely to generate inflation
Under fixed exchange rates,
domestic expansion tends to increase imports faster than exports,
opening up a trade deficit. If this deficit is not counter-balanced by
a tight monetary policy (higher interest rates), then the BoP deficit
tends to get worse - and can only be financed by running down forex
reserves (or increased borrowing from abroad by the Central
Bank). The cure is then contraction of the domestic economy,
tight fiscal and monetary policy, or devluation - which will tend to
lead to inflation.
Purchasing Power Parity:
this theory is derived from the fact that, in the long run, we would
expect the exchange rate to adjust to actual trade flows, rather than
to capital flows, since the latter should ultimately reflect the
international competitiveness of the economy. If trade were all
one way (all imports, for instance, and no exports) then the exchange
rate would depreciate, since more people would be trying to sell
the currency than trying to buy it. On the other hand, if trade
were all exports and no imports, then the exchange rate would be
expected to appreciate. When in balance, imports will equal
exports, and the exchange rate will be stable. What this means is
that exchange rates will tend to adjust (in the long run) so that the
prices of tradable goods are the same in all countries in the trading
world - so there is no incentive to buy in one place and sell in
another. So long as there is no other intervention (taxes or subsidies
etc.) in the domestic markets, then prices will be the same
valued at the so-called purchasing power parity
rates. The Economist
regularly approximates these rates by calculating the exchange rates
which would have to hold if the price of a Big Mac hamburger were to be
same the world over (assuming that Big Mac hamburgers are essentially
tradable). See here for the latest
version of this calculation, and the explanation.
NOTE:
the
capital account is typically much larger than the current (trade)
account. Capital inflows and outflows dominate export and import flows,
so the exchange rate is typically very sensitive to capital movements,
especially short term capital flows (unless these are
controlled). This can cause serious short term problems:
- Any currency which is viewed by the market as being vulnerable is
subject to considerable short term capital outflows, whichmakes the
currency even more vulnerable and liable to devaluation of fixed rate
or depreciation of a floating rate. Speculative bubbles (either bull or
bear) are frequent in the Forex market, especially but not only for the
lesser currencies (can even affect the major currencies - euro, $, yen,
£)
- rapid growth from Foreign Direct Investment (FDI) tends to lead
to currency appreciation as a result of the capital inflows (sometimes
called theDutch disease, after the experience of the Netherlands
when North Sea Oil was first discovered and exploited). This e.r
appreciation puts major pressure on the domestic economy - making
imports more competitive and exports more difficult to sell, tending to
contract the domestic economy. The domestic economy needs to be both
robust and flexible (sensible banks and stock markets) to cope with
this pressure.
Back
to Contents.
5. MacroEconomic
Management:
Economies tend to cycle between booms and recessions:
- Boom -> rising incomes fueling expectations of
further
growth (often associated also with inflation)
- Limited by:
- capacity constraints -> inflation, depreciation of
e.r.,
increased
uncertainty and pessimism about future prospects plus prospect of
active
policy deflation (increasing taxes, increased interest rates)
- Monetary constraints: -> rising interest rates and
appreciating e.r.
-> slower growth
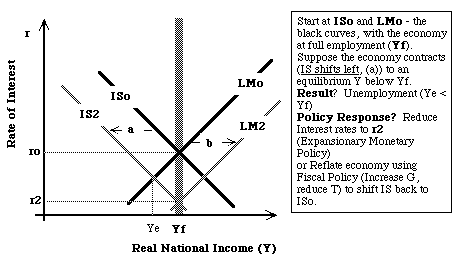
- Recession -> stable or falling incomes (slower
growth),
rising inventories
of unsold goods, increasing layoffs and rising unemployment; also known
as deflation.
- Limited by:
- falling prices encouraging consumption and falling wages or
availability
of unemployed labour encouraging entrepreneurs to expand,
- by offsetting macroeconomic policies
- falling interest rates discouraging saving (hence
increasing consumption) and encouraging investment
- increased government spending (social security payments
etc.) and lower
taxes encouraging income growth
Counter-cyclical macro-management: (trying to actively
predict
and counter-act these cyclical tendencies) Problematic because:
- information on the current state of the economy is always
out
of date, -> response to past conditions, rather than
current
conditions;
- time lags between monetary or fiscal levers and their
effects on
the economy substantial and variable. Monetary Policy
an advantage - changed more frequently and easily than Fiscal Policy;
- the structure of the economy - crudely summarised as the
slopes
of the IS and LM curves - is always uncertain;
- expectations conditon responses - expectations that
booms
will be
exagerated and be followed by substantial recessions will lead to
different
responses from expectations that booms will be slow and longer and less
prone to sudden reversals: so the cyclical behaviour of economies
becomes self-perpetuating.
Active counter-cyclical management tended to exacerbate rather than
ameliorate
economic cycles - boom/bust economies. Prefered option now:
- Automatic [Fiscal] Stabilisers: taxes which increase and
goverment
spending items which decrease as incomes grow - and vice versa, so that
booms and busts are self-limiting (e,g, progressive taxation - rising
with
incomes, or spending-related taxes, withdrawing more as spending
increases
(VAT, excise duties), and also government spending on unemployment
benefit
and social security (providing all incomes are rising and not just
some)).
- Responsible Monetary Policy: aimed at purposive adjustment
of
interest
rates to prevent both inflation and recession - to achieve a low and
stable
inflation rate.
Inflationary (boom) situation:
Deflationary (recession) situation:
Back to Macro Policies
& Reform Agendas
Back to
AEF806
Index
