MKT3000: State & Prospects
for the Global Economy
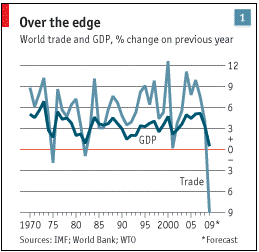
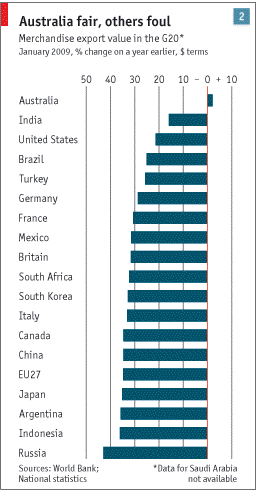
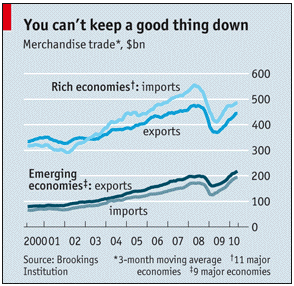
The following charts illustrate the extent of the 2008/9 'crunch' and
its consequences (taken from the Economist: "The nuts and bolts come apart":
Mar 26th 2009 (Fig 1 & 2); and "Defying
gravity and history. Despite dire predictions of a repeat of the
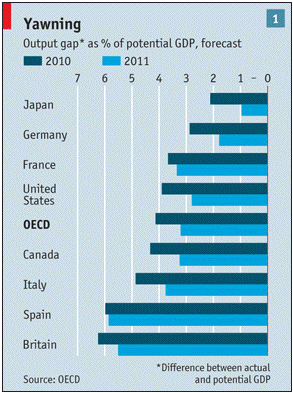
1930s, trade is bouncing back" Aug 5th 2010 (Fig 3); and "How to grow: Without
faster growth the rich world’s economies will be stuck. But what can be
done to achieve it? Our economics team sets out the options" (Oct 7th
2010) Figs 4 & 5:
Note, However - our traditional measures of visible trade balances
(Exports and Imports) are becoming wildly misleading - e.g.
the i-pad story
"The next few years could be
defined as much by the stagnation of the
West as by the emergence of the rest, for three main reasons"
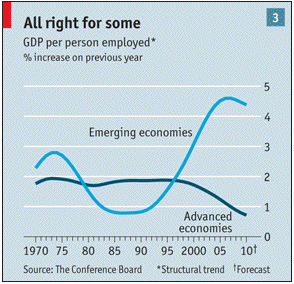
1. Although output stopped shrinking in most countries a
year ago, the recovery is proving too weak to put that idle
capacity
back to work quickly. The OECD does not expect this
“output gap” to close until 2015. (Output Gap - actual output (income)
less the trend/full employment output/income)
2. The trend rate itself depends on the supply of workers and their productivity. That productivity
in
turn depends on the rate of capital
investment and the pace of innovation.
Across the rich world the supply of workers is about to slow as the
number of pensioners rises. In western Europe the change will be
especially marked. Over the coming decade the region’s working-age
population, which until now has been rising slowly, will shrink by some
0.3% a year. In Japan, where the pool of potential workers is already
shrinking, the pace of decline will more than double, to around 0.7% a
year. America’s demography is far more favourable, but the growth in
its working-age population, at some 0.3% a year over the coming two
decades, will be less than a third of the post-war average. ..
Calculations by Dale Jorgenson of Harvard University and Khuong Vu of
the National University of Singapore make the point starkly. They show
that the average underlying annual growth rate of the G7 group of big
rich economies between 1998 and 2008 was 2.1%. On current demographic
trends, and assuming that productivity improves at the same rate as in
the past ten years, that potential rate of growth will come down to
1.45% a year over the next ten years, its slowest pace since the second
world war.
3. Long periods of high unemployment tend to reduce rather
than augment
the pool of potential workers. The unemployed lose their
skills, and
disillusioned workers drop out of the workforce. The shrinking of
banks’ balance-sheets that follows a financial bust makes credit more
costly and harder to come by. [Although: "Despite a lack of
demand, America’s underlying productivity grew faster in the 1930s than
in any other decade of the 20th century. Today’s high unemployment may
also be preparing the ground for more efficient processes." - [source: Economist, How to grow, 7.10.10]
For a continually updated picture of Global Public Debt - see The Global Debt Clock (Economist).
See, also, the Conference
Board - Global Economic Outlook. - "Between 2000 and 2020, the
United States will have lost 8 percentage points in global output (from
23 percent to 15 percent share), and the original 15 members of the
European Union will have lost as much as 10 percentage points (23
percent to 13 percent share)." "China's share in global output doubled
from 8 percent in 2000 to 16 percent in 2010, and will rise to 24
percent in 2020 (all PPP-converted). India will also double its share
of global output (from 4 percent in 2000 to 8 percent in 2020), but its
overall impact on global growth is much smaller than China's."
The Economist also addresses the
question: Is
there a better way to organise the world’s currencies?
Beyond Bretton Woods 2: Nov
4th 2010 (from which these graphs are taken).
- US blaming China for not allowing the yuan to appreciate (citing
the large and growing ForEx reserves in China, reflecting a major trade
surplus - see WTO Trade Forecasts, below), which also makes China's
exports more competitive than they
would otherwise be.
- China retorts that the US 'quantitative easing' (QE - expansion
of the
$ money supply) is a major distortion - depressing bond yields and
interest rates, and (in effect) depreciating the $, and attempting to
avoid the necessary re-balancing of
the US trade (and budget) deficits. The US (and the UK) argues
that it needs to use QE and QE2 to boost the domestic economy - which
it should in one or more of three ways:
- lower interest rates (and yields) are supposed to encourage
borrowing and investment (but this mechanism is clogged by the
increased aversion to risk and the need for the over-borrowed and
over-leveraged banks and finance houses to re-build their assets)
- lower interest rates mean higher asset prices and increased
wealth - the wealth effect encouraging consumption (at least compared
with what it outherwise would be);
- depreciating $ makes imports more expensive and less
competitive, and exports more competitive, so the trade balance should
improve, improving domestic GDP
- How cheap is the yuan (China's currency)? The Economist
argues (6.11.10) that, once you take account of the price (and
wage) changes in China relative to the US, the yuan has actually
appreciated in real terms by 50% against the $ since 2005, rather than
only 22% (the nominal appreciation).
The Economist (Beyond Bretton Woods 2, 4/11/2010 - link above) argues
that there are three basic issues with the present world currency
system:
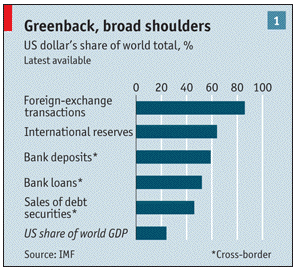
- Should the $ continue to be the global reserve currency,
especially since the US is likely to manage it in US rather than
global interests? [The $ accounts for >80% of world Forex
transactions, and > 60% of world Forex reserves, though the US
only accounts for 24% of global GDP]
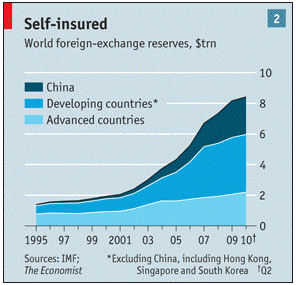
- What can be done about the escalating Forex reserves,
especially
in emerging economies, which have risen from $1.3trn. (5% of global
GDP) in 1995 to $8.4trn. (14%) in 2010, with emerging economies
holding 2/3 of the total. Why aren't these economies investing in their
home countries, rather than lending to the developed world?
- What can be done about the scale and volatility of
capital
flows? If capital can flow across borders, then any
individual
country cannot both control its domestic monetary conditions and its
exchange rate at the same time - it has to be one or the other.
The US is complaining that China is chosing to control its exchange
rate (and losing control of its domestic monetary conditions - China
complains that the US is chosing to 'control' its domestic money
markets, and is abandoning concern over exchange rates (and the reasons
for the imbalances).
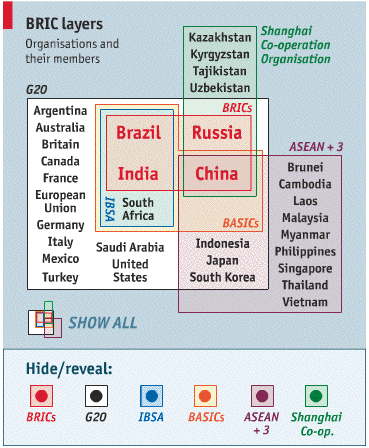
Who's Who in the world: Trade and Economic Policy
'Blocks'
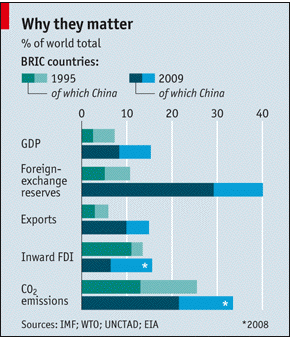
For an excellent brief on the BRICs
see "The trillion-dollar club Brazil, Russia, India and China matter
individually. But does it make sense to treat the BRICs—or any other
combination of emerging powers—as a block?" Economist, Apr 15th 2010
[e.g. Latin American growth & growing middle class & A series of snapshots of China's growth record over the past 45 years. + two recent (June, 2012) BBC documentaries: China's Economy: The Insider's View, parts 1 & 2, by a top Chinese business journalist, Rui Chenggang]
For an excellent/authorative review and summary of the present state of
the Global Economy and its components, see: Postcrisis
Growth and Development: A Development Agenda for the G-20: Overview
(A briefing arising from a joint high-level conference on development
in Busan in June 2010 organized by South Korea and the World Bank, in
preparation for the Seoul Meeting of the G20 ,
Nov. 11 & 12, 2010.) - especially the opening sections, which trace
the history of the major Global negotiating blocks.
[G20: "Together,
member
countries represent around 90 per cent of global gross national
product, 80 per cent of world trade (including EU intra-trade) as well
as two-thirds of the world's population. The G-20's economic weight and
broad membership gives it a high degree of legitimacy and influence
over the management of the global economy and financial system."
G20: US, China, Russia, India, Brazil, UK, Germany, France,
Italy,
Japan, Canada, Australia, South Africa, Korea, Indonesia, Turkey,
Argentina, Mexico, Saudi Arabia + EU/ECB and IMF and WB]
"Whereas the gross domestic product (GDP) of developing countries represented about 17
percent of global GDP in 1980, as of 2008 their share had increased to
29 percent, with a
contribution to global growth of about 50 percent. Despite
this progress, development challenges remain daunting and gaps persist,
with the current crisis further complicating efforts to reduce poverty
and meet the Millennium Development Goals
(MDGs). Because of the global economic crisis, an estimated 64 million more people in developing
countries will be living on less than $1.25 a day (76 million more on
less than $2 a day) in 2010. Even by 2015, the additional number of
poor attributable to the impact of the crisis could be 53 million and
69 million, respectively, based on these two poverty lines."
"The increasing globalization that the world has experienced in recent
decades—supported by multilateral trade policy reforms, broad
liberalization in domestic trade and investment environments, and
technological advances—has facilitated the acceleration of growth in
developing countries and, by extension, the importance of these
countries in the global economy." (p7):
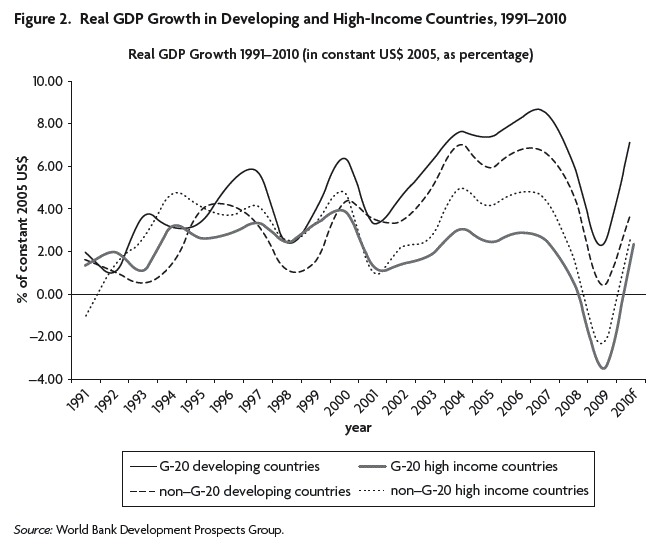
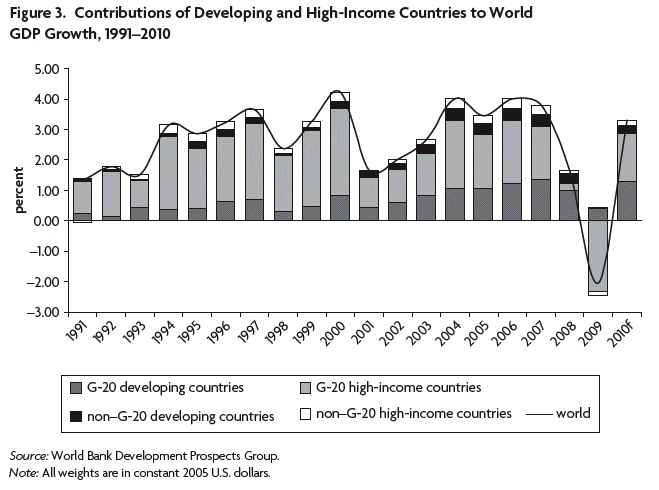
"Because developing countries are growing faster, they are also
increasing their share in global GDP. Whereas developing country GDP
represented about 17 percent of global GDP in 1980, as of
2008 that share had increased to 29 percent, when measured at market
exchange rates and close to 45 percent if purchasing power parity
weights are used. Those that are contributing the most to this new
global economic landscape are the developing countries that are also
members of the G-20; China and to a lesser extent India have been the
main drivers of these shifts. In 1980, China accounted for 1 percent of
global GDP. As of 2008, China’s share had increased to 6 percent of
world GDP (11 percent in PPP terms), accounting for a larger share in
the global economy than the economy of Germany or the United Kingdom.
India has also emerged as a player, with a 2 percent share in world GDP
in 2008, similar to Canada’s and Korea’s shares." (p8)
"Developing countries’ share of
global exports has also grown quickly, rising from 22 percent in 1980
to 31 percent in 2008. Developing country members of the
G-20 have led this shift: their share in global exports, which
accounted for 6 percent of world exports in 1980, rose to 19 percent in
2008, with China, Brazil, India, and Mexico leading the way. The same
can be said of net foreign direct investment (FDI). Developing countries’ share in global FDI
was 7 percent in 1980, and by 2008 their share was 32 percent
(with 21 percent coming from the developing-country members of the
G-20)." (p 9) - see pages 9 and 10
for the relevant charts.
See, also, the WTO
Forecasts of future trade growth
(and charts of recent histories and Trade balances for the G20) 20. 09.
2010. - more recently (September 2012) trade growth slackens again, and appears to be heading for another recession? FDI inflows also falling in 2012 versus 2011, though GDP/head growth rates recovering to pre-crisis levels (2012), while GDP growth rates continue to show a 'double dip' character.
Meanwhile, OECD/UNCTAD warn that "Rising
tensions could degenerate into protectionism". However, (October, 2012), Lamy (WTO DG)
notes that "“there has been a slowdown in the imposition of new trade
restrictive measures by G-20 economies over the past five months”.
However, “at a time of continuous economic difficulties, trade
frictions seem to be increasing”. He urged G-20 governments “to
redouble their efforts to keep their markets open, and to advance trade
opening as a way to counter slowing global economic growth”.
But longer term implications of demography and growth patterns (OECD) to 2060 imply some catch-up in GDP/head, but not equalisation (see here for the gory detail of the projections)
Is Fiscal Austerity a sensible
way to tackle a recession? The major argument for
(pro) is that a credible plan for regaining budgetary balance removes
uncertainty and fear of future (unspecified) cuts and/or the danger
that finance markets will not tolerate the lending demands of countries
with large and apparently uncontrollable debts, and will charge
increasingly large (and damaging) interest rate premia to be prepared
to shoulder this debt (i.e. buy the government bonds), if they are
willing to at all for fear of default - which drives up domestic
interest rates and makes the debts even worse, if not actually
unsustainable.
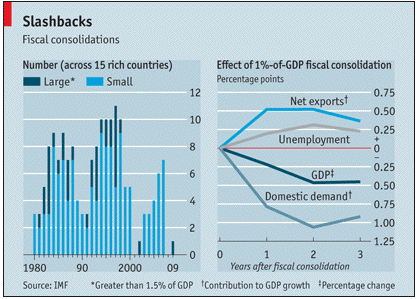 From the Economist, Sept 30, 2010: Does
fiscal austerity boost short-term growth? A new IMF paper thinks not:
"The IMF reckons that on average a rich country attempted a fiscal
contraction of more than 1.5% of GDP about once a decade. (There were
also many smaller consolidations; see left-hand chart.) It finds that
the typical such episode is clearly contractionary: a fiscal
consolidation equivalent to 1% of GDP leads on average to a 0.5%
decline in GDP after two years, and to an increase of 0.3 percentage
points in the unemployment rate. Spending cuts do less damage than tax
rises. This is mainly because they seem to be associated with bigger
declines in interest rates. The fund’s economists reckon that this may
be because central banks view spending cuts as a stronger signal of a
commitment to fiscal prudence and so are more willing to provide some
monetary stimulus to soften the blow.
From the Economist, Sept 30, 2010: Does
fiscal austerity boost short-term growth? A new IMF paper thinks not:
"The IMF reckons that on average a rich country attempted a fiscal
contraction of more than 1.5% of GDP about once a decade. (There were
also many smaller consolidations; see left-hand chart.) It finds that
the typical such episode is clearly contractionary: a fiscal
consolidation equivalent to 1% of GDP leads on average to a 0.5%
decline in GDP after two years, and to an increase of 0.3 percentage
points in the unemployment rate. Spending cuts do less damage than tax
rises. This is mainly because they seem to be associated with bigger
declines in interest rates. The fund’s economists reckon that this may
be because central banks view spending cuts as a stronger signal of a
commitment to fiscal prudence and so are more willing to provide some
monetary stimulus to soften the blow.
Indeed, declines in interest rates, which also weakened countries’
exchange rates, help explain why GDP did not decline even more sharply.
The short-term policy interest rate fell by an average of about 20
basis points for a fiscal consolidation worth 1% of GDP. A rise in net
exports due to a real depreciation also helped cushion the blow,
although not enough to overcome falls in domestic consumption and
investment (see right-hand chart).
At the moment, however, there is less scope for these mitigating
factors. Interest rates in most rich countries cannot fall much
further. And a country cutting its deficit now would not be doing so
alone (which would reduce the impact on exports). Simulations carried
out by the fund show that slashing spending in an environment where
interest rates have no more room to fall doubles the contractionary
effect of such cuts compared with a situation where the central bank
still has scope to cut rates. In such a situation, GDP can be expected
to decline by 1%, rather than the historic average of 0.5%. If, in
addition, everyone else is cutting, the effect of a fiscal contraction
is further magnified. Most people believe that fiscal consolidations
are helpful in the long run. Expecting them to be painless looks like
wishful thinking."
Conclusion?
Expect some 'backtraking' and delays in the programme of budget
contractions - politicians will find reasons to delay and backtrack if
economies look as though they are slipping back into recession - and
expect that at least some in the financial markets recognise this and
are prepared to make the necessary allowances.
Meanwhile - how have tax burdens changed over the last 50 years (in OECD countries)? OECD data - and Economist summary. and some commentary. and some relative income tax rates, and how they have changed since 1981. And what is left to do? - 'fiscal gaps versus action to date' (and see OECD (2012) full report on this)
For an expert overview of the changing shape of international trade, see Pascal Lamy's Snape Lecture, Melbourne, Nov. 2012. - some highlights: "The rising weight of influence of emerging economies has shifted the balance of power. This clearly implies a number of transitions to which we have not yet adjusted as classic Westphalia concepts of sovereignty are being challenged by the realities of interdependence.
Some may consider this a problem; it is perhaps better to think of it
as an opportunity to look at the real shaping factors of trade. ...
There have been false recoveries, unpredictable growth rates and a reassessment in many quarters as to the very theological basis of our economic models. ...Decades from now scholars and policy makers will look back on this period as a watershed moment
in how we approached trade and economic policy. Whether we,
collectively, recognised the missteps of the past and learnt from them
or whether we continued to forge ahead on the road already traversed.
..... This is no longer the world of the twentieth century dominated by
the US pillar on one side and the European pillar on the other. We are
in a twenty-first century multi-polar world. Ricardians would see this as a natural progression of comparative advantages while the Westphalia model would see this as a breakdown of the order of the nation state. I see this as the contemporary form of multilateralism, with notions of sovereignty being challenged by realities of interdependence.
I see this as an opportunity. Opportunities for policy makers to take a
new look at the forces moving trade and political-economic discourse.
....
Africa’s exports to developing countries tend to be more diversified
than its exports to developed countries. A similar shift in trade from
developed to developing economies can be seen on the import side as
well. The share of developing economies in African imports rose from
around one-third (34 per cent) to more than a half (53 per cent)
between 2000 and 2011. ...In addition to the reconfiguration of the
actors in the multilateral trading system and the changing patterns of
trade moving away from traditional North-South lines and also
incorporating greater intra- and inter-regional trade, we are also
seeing new trends in the way that goods and services are produced and traded.
In essence there is a new narrative developing on trade which
governments and business have to take notice of and align their
policies and priorities around...today almost 60 per cent of trade in
goods is in intermediates or trade in tasks and the average import
content of exports is around 40 per cent. .. the way we measure trade needs to change. ...The WTO, working with the OECD and many other partners, will contribute to this effort when we release
the first set of comprehensive statistics on trade in value added
during a conference in Geneva in mid-December this year....The
fact that intermediate goods need to cross the border of developing
countries involved in value chains multiple times means that the cost
of any type of trade restriction will be magnified. Not only must
tariffs be low but regulatory regimes have to be compatible, otherwise
non-tariff measures and regulatory divergence will prevent the
efficient functioning of value chains. This regulatory convergence is
important in ensuring that value chains really work for countries.
..One of its most important findings was that the nature of NTMs (Non Tariff Measures)
has shifted: the traditional protection-motivated quotas and safeguards
have increasingly given way to a precaution-oriented emphasis on
health, safety, environmental quality, and other social considerations.
These concerns are wholly legitimate, and cannot — indeed, should not —
be blindly trumped by a desire to keep trade completely
unobstructed. ...convergence among countries at very different
levels of development is rarely straightforward. Moreover, mutual recognition and harmonization can raise tough questions about trust, good governance and domestic regulatory autonomy. Co-operation
among governments — in standard-setting bodies, regional fora and
multilateral organisations — remains the best way forward.
The standstill in the (Doha) negotiations — when taken to its very
basic level — is premised on the relative contributions that members at
different levels of development could or should make. As in other
organisations and on other issues, such as on climate change, this is a
question that the international community cannot ignore. To move
forward on multilateral negotiations, this basic question of “rights” versus “responsibilities” must be addressed. Overall, the OECD estimates that for its members, the fees, formalities and clearance procedures constitute roughly 10 per cent of the value of any trade transaction. This is almost double the worldwide average trade-weighted tariff.
Globally, that is close to $2 trillion. A WTO deal on trade
facilitation would reduce those costs from 10 per cent of the value of
trade to 5 per cent of its value.
Stakeholder Panel on Defining the Future of Trade,
stablished in April 2012 to analyse challenges to global trade opening
in the 21st century, to look at the drivers of today and tomorrow’s
trade, and to examine trade patterns and what it means to open global
trade in the 21st century... the findings of their work will be presented in the New Year. "
The 2011 Euro Crisis:
(Posted 23.11. 2011) The roots of the crisis? See
the Economist, 12.11.11 for a
"Very
Short Hisory of the Crisis" which is part of a "Special Report" on
the crisis, containing several other useful analyses of the situation
and its causes, as well as a link to a very useful interactive
chart of European countries and their economic conditions,
including GDP growth, GDP/head, Unemployment rates, Public (general
government) Debt, Government's Budget Balance, Average Debt Maturity
(when the current issues of Government bonds expire and need
re-financing, and hence require re-issue of government bonds). See Economist's Buttonwood on the relationships between democracy and government debts (Sept. 2012). More generally, Ian Hislop
(Editor of Private Eye)
presented a watchable programme on British
Victorian Bankers (When Bankers were good) on BBC2 on 23.11.11,
which is available until 1.12.11 to watch, and includes a short
interview with Lord Adair Turner, the head of the British Financial
Services Authority (FSA) which is shortly to be disbanded and
re-absorbed into the Bank of England, as the overall watchdog of the
British financial sector. (This interview is 14.46 minutes into the
programme). He points out that it is very difficult to imagine a modern
productive economy without a banking and financial sector, but that
this sector needs to keep the value of what it is doing (channelling
savings into productive and socially useful activity) at the front,
rather than the back of its minds. See, also, the three part BBC
radio series - Stephanomics
- in which the BBC's Economics Editor, Stephanie Flanders,
discusses the global financial crisis with top economic thinkers, and
also her blog.
Another useful site is the BBC's Global
Economy site. A reliable (in this lecturer's opinion)
commentator on the world economy is Martin Wolf (currently
with the FT) - an historical perspective on the Euro Crisis. His recent two part BBC Radio series: New
Global Economics, is also well worth listening to (53 minutes) (if it doesn't load, get it as a podcast here), in
which he examines "how the world has
changed since the beginning of the financial crisis four years ago, and
asks if the pre-2007 era might be the high point for free market
capitalism. In the future, the combination of austerity and an ageing
population will mean that money will be tight, affecting the political,
economic and social life in developed countries. At the same time, how
will a shift to an Asia-centric financial ecosystem constrain developed
nations in future?"
Meanwhile - track the forecasts for the Eurozone growth rates in real time, while growth (and the lack of it) in the Eurozone continues to affect world markets, and the credit crunch recession has cost the rich world years of lost output (and income) - and the effects of the crunch on unemployment rates
For your lecturer's 'take' on the
fundamentals, see "Transition
to what? Reflections on Capitalism as an Ideology" (DRH, paper
delivered in Corvinus University, Budapest, 2010, and later in Prague,
2011). Another way of phrasing the arguments in this paper: Barter
(and hence the developmental possibilities of specialisation and trade)
only became seriously
lubricated and dramatically extended with the invention of money - a commonly accepted and trusted medium of exchange which could
'stand in for' the equivalent amount of any good or service (and hence
allowed for and required the articulation of a price for each good and service as
the amount of the common numeraire
- money - which a unit of the good or service commanded). ->
whatever is used as money, it had better be: convenient and easy to
use, carry, store (and so be durable/hard-wearing) etc.;
difficult/impossible to counterfeit; and so be reliable - if
anyone/everyone can 'print' their own, they will and the 'money' will
quickly become useless - the rules
(properties of money, in this case) have to be
made by people and their governers and stuck to for socio-evolution to
be sustainable. Money is a fundamental and archetypical
exhibition of the endogeneity of the selection criteria in
socio-economic
evolution: if we cease to believe in it, it ceases to work; if we
worship it, we get what we deserve.
Interestingly, another heterodox economist has developed
a substantial critique of conventional macro-economic textbook analysis
which puts money (and therefore credit) at the heart of the analysis -
Steve Keen, University of Western Sydney - See, for instance, "Why
Credit Money Crashes" for a lecture on the model and its
implications - extensively explored on his web site.
In essence, Keen argues that we need to go back to basics - the CFoI,
and think of this as if we begin at equilibrium, and then consider how
an expansion of spending (either through C or I or G) actually happens
and what the consequences are. First, debts must increase - since
there is no actual income (at equilibrium) to finance increased
spending wherever it comes from. [Even export led growth, where
X>Imports, opens a negative balance on the balance of trade for an
individual country, which must be financed through an increase in
capital inflows (i.e. an increase in credit from elsewhere in the
world), other than through a depreciation of the currency]. The
increased debt (creation of new 'credit money' in the banking system)
then gets spent on what? Consumption, or physical investment (new plant
and equipment etc.), OR on assets (which must push their prices
(values) up. So long as the increased debts finance increased
physical capital (productive capacity) and so long as this new
productive capacity turns out to be succesful and profitable, all will
be well. But there is a strong tendency for the increased spending to
push up asset values, and create the incentives for the finance markets
to chase apparently profitable 'investment' in rising asset prices
(which also seem to fulfill the inherent prophecies of profitable
financial investments). Eventually, however, the asset bubble must
burst, and the 'Ponzi' investors will go bankrupt - trigering a
collapse of the bubble and the a de-leveraging of the growth. Since GDP
(spending) in nominal terms must equal national income (Y) plus change in debt, any increase (decrease) in GDP (spending)
must equal the increase (decrease) in National Income PLUS the increase
in the increase (decrease in the decrease) of debt. - This
dependence of national income (GDP) on the rate of change of the rate
of change of debt leads to two important implications:
1) that the debt accelerator is especially powerful in determining
National income (national income is likely to be very sensitive to
changes in debt - inevitable cycles).
2) that growth both depends on debt, and (according to the Keen model)
tends to increase in level as growth occurs - eventually leading to the
necessaity for a substantial write-off (default) of accumulated debts
in order to prevent a complete melt-down of the system - bankruptcy has
to happen periodically (or inflation is necessary to effectively wipe out the debts), unless all investments actually add to
productive capacities.
See World Debt guide - interactive charts.
"IN THE years before the financial crisis, the rich world was surfing
on a wave of private debt. Our interactive guide (updated on September
19th 2012) shows levels of debt as a percentage of GDP for a selection
of rich countries and emerging markets. Between the first quarter of
2004 and the first quarter of 2009, private-sector non-financial debt
rose by an average of 43% of GDP in the Western countries shown
(excluding Germany). Since the crisis the debt burden has spread to the
public balance-sheet. The costs of bail-outs and fiscal stimulus, and
the effects of slow economic growth on tax revenues, have sent the
ratio of government debt to GDP spiralling. The private sector has at
least begun to deleverage: private-sector non-financial debt has
decreased by eight percentage points on average in the past three years
for those same six countries. But there is an awfully long way to go to
turn back the clock."
Some footnotes:
House Prices -
around the world - against income and rents. House prices can be
a barometer of asset prices - and their balance against both incomes
and the rents they command.
How good are GDP Forecasts? (Results for the IMF's forecasts).
BRICs running out of steam, and their credit availabilities versus GDP (Economist, July 2012)
China's growth record since 1980 - driven by investment (and savings) rather than exports. - see, too, the Economist (May 2012) special feature on China's economy, and when it overtook/will overtake the US.
Doing business around the world - see the World Bank's data.
Back
to Index
Comments or Questions?