Prof. P. A. Christensen
Home
News and recent publications
Vacancies
Information for group members
Clarizon Ltd
Services to business
Updated: 28 Jan 09
|
<< Back to previous page ----- Home
In-situ FTIR spectroscopy/continued
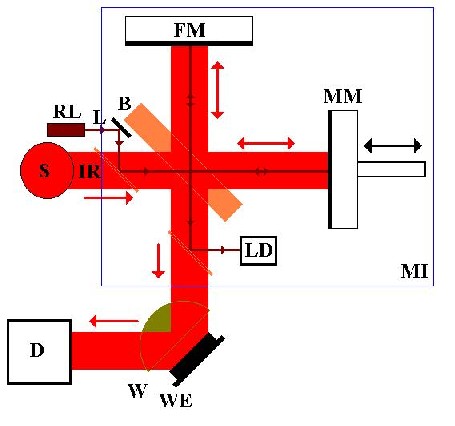
Figure 1 The interferometer
The IR beam leaves the source, S, and is incident on a beamsplitter, B. 50% of the light is transmitted to a moving mirror, MM, and 50% to a fixed Mirror, FM. On reflection, these rays recombine and interfere at the beamsplitter before reaching the detector, D, via the window, W, and reflective working electrode, WE, of the spectro-electrochemical cell. The system also includes a reference laser, RL, which follows the same path through the interferometer, after which it is intercepted and directed at the laser detector, LD. Monochromatic light, such as the laser beam, passing through the interferometer gives rise to a signal at the detector as shown in fig. 2(a), due to constructive and destructive interference.
Figure 2(a) the laser signal
X is the retardation, or distance the moving mirror is away from zero path difference. A plot of intensity vs retardation is termed an ‘interferogram’. By counting the maxima (fringes) in the separately monitored laser signal, the position of the moving mirror at any time is accurately determined. When multiple wavelengths, ie. from the IR source, enter the interferometer, the combination of a variety of frequencies and intensities produces an interferogram such as that shown in fig. 2(b); ie. the intensity at the detector dies off rapidly as x increases.
Figure 2(b) The interferogram
The interferogram is actually a series of data points
(retardation,intensity) collected during the smooth movement of the
mirror. Using a mathematical function known as a Fourier Transform,
the spectrometer computer is able to deconvolute (‘Fourier
Transform’) all the individual cosine waves that contribute to the
interferogram, and so produce a plot of intensity against
wavelength, or more usually the frequency in cm-1; ie. the infrared
single beam spectrum. All the retardation data points are necessary
to obtain the spectrum. In essence, the computational capacity of an
FTIR spectrometer, and the accuracy of its laser referencing system,
allows the co-addition and averaging of individual spectra, or
‘scans’, to produce spectra with improved S/N; coupled with very
rapid data collection times, routinely down to c. 10 ms, and high
throughput, (beam power in sample compartment typically c. 100mW),
this means that a few seconds data collection time are sufficient to
generate a spectrum of sufficient sensitivity to detect adsorbed
species at the electrode, a major goal since the 1980’s.
The data manipulation removes any contribution to the spectra
that does not change with potential or time, and is generally as
follows: a spectrum (Sr, typically 100 co-added and
averaged scans, 8 cm-1 resolution, c. 3 - 30 s per
scan set) is taken at the reference potential, and the potential
stepped up or down, and further spectra, Ss, taken either
as a function of potential or time. The resultant difference spectra
are plotted as either (Ss - Sr)/Sr or log10(Ss/Sr) vs wavenumber; in either case, peaks pointing up, to + R/R or +’Abs’,
represent loss of chromophore at the working potential vs the reference potential, peaks pointing down, to - R/R or -’Abs’, are
due to the gain of chromophore. More recently, by exploiting
the Real Time Display option on the FTIR spectrometers, it has
proved possible to obtain absolute spectra, invaluable in the study
of conducting polymer systems.
The most recent cell design employed in the group is shown
below in fig. 3:
Figure 3 The Newcastle in-situ electrochemical FTIR cell
The cell is constructed entirely
of PTFE and glass. The baseplate(5) allows resistive heating of the
near-window area of solution, whilst the jacket allows heating or
cooling of the bulk of the electrolyte. A different baseplate is
employed in experiments at temperatures below ambient. (1) CaF2 prism; (2) window mount; (3) gasket; (4) spectrometer sample compartment lid; (5) baseplate; (6) gasket; (7) heating resistors; (8) polished working electrode; (9) teflon electrode body; (10) gasket; (11) thermocouple and working electrode contact; (12) glass cell body; (13) water input to cell jacket; (14) counter electrode and (15) spectrometer sample compartment.
<<Back to previous page ---- Home>>
|