History I: (see here for a longer abreviated version of UK farm policy history)
UK supported the farm sector between 1947 and 1973 with Deficiency Payments - annual payments from the Government Exchequer to farmers, making up the difference between actual market prices and guaranteed prices on the total quantities sold by farmers. Guaranteed prices were set annually by the government in consultation with the NFU (in the Annual Price Review) and reflected judgements about the costs of production and fair prices for farmers.
In 1973, the UK joined the European Community and the Common Agricultural Policy. The CAP used a different system to support farmers - it effectively taxes imports of farm products from outside the EU (and also subsidises exports from the EU) which raises the internal domestic EU price above the ruling world market price (see Buckwell, Ch. 7, Ritson and Harvey (eds), 1997). Thus, on entry to the CAP, UK market prices were increased and the deficiency payment system was scraped.
The debate prior to UK entry about whether or not to join emphasised the effects of EC membership on food prices (they would go up for the consumer) and on the benefits to farmers (where it was anticipated that EC supported prices would be higher than the guaranteed prices).
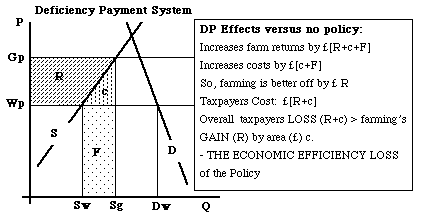
How can one try and organise this debate so as to get an idea of the potential gains and losses from entry? Answer: by using some very straightforward economics. Consider a simple and stylised diagram of (as a major part of the agri-food system) the UK cereals market. Under the Deficiency Payment system, this market can be represented as follows: (Figure 1).
If these curves are reasonable representations of the real world, then the consequence of the DP policy is to increase the total returns to cereal farmers over and above what they would get without the policy Reference: Ritson & Harvey (ed), 1997, The Common Agricultural Policy, 2nd. edn. CAB International, Chapters 7, 8, 17 & 18 .
Here, the guaranteed price is Gp/tonne, the world price, at which consumers can buy foodstuffs, is Wp/tonne. The present supply under the policy is Sg m. tonnes, while the quantity consumed is Dw. Suppose that the Supply and Demand curves (showing the response of Producers and Consumers respectively to cereal price changes, ceteris paribus - nothing else changing) are as shown by S and D.
Figure 1 Economics of the Deficiency Payment System:
- Importer Case. [UK 1947 - 1973] [DP is subsidy of Gp-Wp on every tonne (Sg tonnes)]

DP Effects:
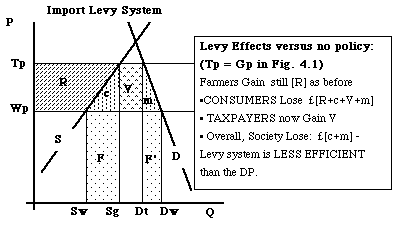
A TAX (known as a VARIABLE IMPORT LEVY) is charged on all imports of cereals into the community to increase the price of imports from Wp - the world price, at which importers to the EC are willing to sell the product to EC buyers - to Tp - the ÒThreshold PriceÓ set by the Council of Ministers for the EC market.
So long as the EC remains an importer, buyers cannot satisfy all their demand from the local market and are obliged to import. Since we assume that the product is homogeneous, that is - there is no distinction between imports and local product, the domestic market price will be set by the available imports at price Tp. Thus, no one in their right mind would sell local domestic cereals for less than Tp - there are no available additional supplies from abroad at less than this price
[Note: The tax is called a variable levy because the actual amount of the tax per tonne varies as world prices change to keep the Threshold price constant.]
Market Prices in the EC would be Tp, NOT Wp - the consumer would pay more (and thus consume less), but the Taxpayer would now GAIN the proceeds of the Import Tax (levy) rather than have to pay out for DPs.
FOR ANALYTICAL PURPOSES, SUPPOSE THAT Tp IS SET AT THE SAME LEVEL AS Gp (it wasnÕt in practice - Tp was expected to be higher than Gp). We can see the effects of the EC Import Levy policy on our market diagram - Figure 2.
Figure 2 Economics of the CAP (Old Style) Levy Effects:

It is, in essence, the increase in the Gross Margin of the industry, defined as the increase in Revenues minus the associated increase in Costs of Production. This can be taken here as equivalent to the increase in the Gross Product of the industry - its contribution to the EconomyÕs national income. This increase in gross margin or gross product accrues to the owners of the fixed factors in the industry - land, labour, capital and management. - See Ritson & Harvey, 1997, Chapters 7 & 8, especially, for this.
Question: So what happens in the industry when the policy generates or increases R?
Question: What has been the History of EU Farm Support?
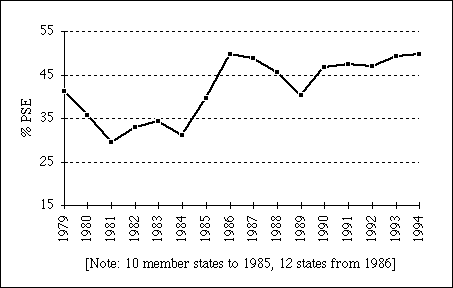
Can be measured by the ÒProducersÕ Subsidy EquivalentÓ (PSE)
Figure 3: The EU PSE (as % of total farm receipts): ( as estimated by the OECD):

Note: The PSE is actually a measure of areas R + c in each of the diagrams above, here estimated for 16 commodities over the whole of the European Union, expressed as a % of total farm receipts (Tp*Sg). It is, essentially, an estimate of the difference between internal domestic EU prices and the relevant world price (called the Òreference priceÓ by the OECD) times the total quantities produced in the EU. In addition, other government spending in support of farming (such as under the Guidance part of the European Agricultural Guarantee and Guidance Fund) is also included in the support measure.
The total support figure is the expressed as a percentage of the total revenues of the industry (domestic price times quantity produced plus any other Ôdirect paymentsÕ from the government). The variations in the percentage figure shown here largely reflect variations in world prices, either in dollar terms and/or through variations in exchange rates between the EU and the rest of the world.

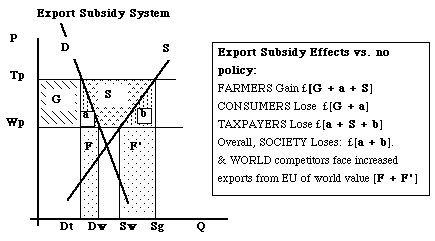
The Rest of the World, especially the major exporting countries (US, Canada, Australia, NZ, Argentina, Brazil etc.) find their markets now challenged and ÔpollutedÕ by subsidised EU exports, and can be expected to complain and seek redress.
EU finds that the more it exports with subsidies, the lower world prices are - excess supplies on the world market are bound to drive world prices downwards, so export subsidy per unit (and in total) tend to increase, exacerbating the taxpayer pressure on the policy.
Meanwhile, the pressures on farm incomes are continuing, leading to a rapid decline in the number of people engaged in agriculture, so political force of farm sector declines (though slowly because people have long and fond memories of their farm ancestry)
Pressures lead to GATT Uruguay Round, 1986 start, and 1992 CAP reforms
And to Agenda 2000. - response of the EU to the challenge of Central and Eastern European (CEE Countries) Enlargment
See here for an outline of the answers to the questions above.
See here for an illustrative analysis of the MacSharry reforms - pdf file of 12 pages - (Agenda 2000 does not substantially alter the thrust of this analysis). This is taken from: Harvey, "Policy Reform after the Uruguay Round", Ch. 11 in Agriculture in the Uruguay Round, ed. Ingersent, K., Rayner, A.J. and Hine, R.C., Macmillan, 1994, p223 - 269.
Professor Colman, Manchester University, and I have recently (Jan. 2002) completed a study of the consequences of eliminating dairy quotas (pdf, 9 page summary) in the EU, and conclude that the EU as a whole would be better off by 6bn. euro per year without dairy quotas and associated market support, albeit resulting in a loss to the owners of quota (and other dairy farm assets) of 8.6bn. euro per year. However, a limited annuity, over 7 years, at the cost to consumer and taxpayer of the present policy (€10.8bn per year) would be enough to fully compensate producers for their total losses consequent on elimination of quota and the associated price support policy. Thereafter, this level of funding could be used to achieve other more important policy objectives connected to rural development and conservation of the environment. For those who think they want more detail - the final chapter of the report (27 pages, pdf) outlines the political economic assessment of the reform options.
You can find the full documentation of Agenda 2000 and also about the Mid Term Review proposals under this heading (2003) at the Eurpean Commission's web site:
See, also, the full report of an 'expert group', chaired by Prof. Allan Buckwell, Wye College (author of chapter 6 of the Ritson & Harvey text) on the future of Common Agricultural and Rural Policy
You should also be aware of the UK House of Commons Select Committee Report on Agenda 2000 and agriculture, 1998
Finally, see the current statement (Dec, 1999) of the MAFF on A New Direction for (British) Agriculture - pdf file, 16 pages - and look at the discussion documents associated with this paper on the MAFF website Also, if interested in the UK especially, see the reference archive (index page) for the link to the Curry Commission report - Jan. 2002.
For a one page outline of the arguments about future support for farming in the EU see Viewpoint: How necessary is government support and regulation for Agriculture?, EuroChoices, premier edition, Spring, 2001. p 59. (joint publication of the AES and EAAE)
Back to top
Back to AEF362 Index
Back to AEF811 Index