|
Climate model validation |
This work was part of the SWURVE project and has been published in:
Fowler, H.J., Ekström, M., Kilsby, C.G. and Jones, P.D. 2005. New estimates of future changes in extreme rainfall across the UK using regional climate model integrations. 1: Assessment of control climate. Journal of Hydrology, 300(1-4), 212-233. [Abstract]
Fowler, H.J. and Kilsby, C.G. 2004. Future increases in UK water resource drought projected by a regional climate model. Proceedings of the BHS International Conference on Hydrology: Science & Practice for the 21st Century, London, 12-16 July 2004.
and is also in progress as part of the BETWIXT project.
An assessment of the control climate of the HadRM3H regional climate model has been carried out under various guises. Some of the results are shown below:
(a) Mean climate
The HadRM3H model overestimates mean rainfall in winter and spring months, particularly at high elevations in a similar way to HadRM2 (Jones and Reid, 2001), but underestimates rainfall in summer and autumn (Figure 1). These seasonal anomalies lead to a significant underestimation of annual mean rainfall in some parts of the UK (see Figure 1). This is particularly apparent around eastern coastal regions, and also in the Cheshire plain where, in one of the ensemble members, mean annual rainfall is as low as 250 mm (observed values are between 600 and 700 mm). This is probably the result of an over-dominance of orographic control on rainfall within the HadRM3H model. Not only does this produce a large overestimation of mean annual rainfall in areas of high elevation, but regions on the leeward side of areas of high elevation, such as the north-east England coast, show a classic ‘rain-shadow’ effect with very low simulated mean annual rainfall. For applications seeking to use regional model rainfall output, it is therefore advisable to firstly compare it with observations and secondly, to use a suitable collection of grid squares rather than a single square.
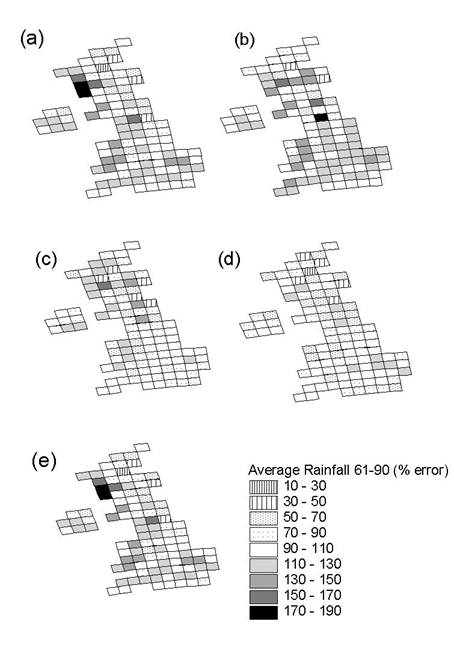
Figure 1 Percentage errors in representation of mean rainfall 1961-1990 by HadRM3H Control Scenario when compared to UKMO dataset (where 100% represents a perfect match, 0-100% represents underestimation, and 100+% represents overestimation): (a) winter, (b) spring, (c) summer, (d) autumn, and (e) annual.
(b) Drought
These biases in the simulation of mean precipitation have a knock-on effect on the simulation of other important precipitation parameters in terms of drought. In particular, cumulative dry days (days with less than 1mm precipitation) are significantly overestimated by the control climate simulations when compared to the UKMO5K dataset across almost the whole UK, and particularly eastern and south-eastern regions (ES, NEE, CEE and SEE) due to the underestimation of summer and autumn rainfall by HadRM3H. For the most severe drought events therefore, it is unsurprising that the model also overestimates the incidence of historical drought.
In this study we examine two types of drought event. The first, DRO3, is defined as a 3-6 month short drought having an accumulated deficit exceeding 10% of mean annual rainfall, more likely to affect surface water resources and based upon DSI3. The second, DRO6, is defined as a long drought of 6+ months such as 1975-1976 with an accumulated deficit exceeding 30% of mean annual rainfall, likely to further affect ground water resources and based upon DSI6. Tables 1 and 2 show a comparison of the maximum duration (in months) and severity (as a percentage deficit of mean annual rainfall) for droughts during a 30 year period from 1961-1990 for observed (UKMO5K) and modelled (HadRM3H Control) data. It can be seen in Table 1 that the maximum duration of DRO3 and DRO6 droughts are overestimated by the model, particularly for longer duration droughts. Similarly, the maximum severity of drought is overestimated for the longer events (DRO6) (see Table 2).
Table 1 Maximum duration of drought in months during 1961-90 for observed (UKMO5K) and modelled (HadRM3H Control) data and percentage future changes predicted under the A2 and B2 scenarios.
|
Region DRO3 DRO6 UKMO Con Fut A2 Fut B2 UKMO Con Fut A2 Fut B2 NS 13 26 −38% +64% 26 29 −3% +32% ES 10 20 0% +90% 17 54 −48% +26% SS 15 21 −38% −11% 17 29 0% −36% NEE 11 17 +29% +38% 17 31 +6% +40% NWE 12 19 +53% 0% 20 25 +16% +55% NI 14 19 −5% +25% 16 27 +11% +129% CEE 15 15 +27% +40% 16 31 −26% +150% SEE 12 15 +20% +67% 14 27 −4% +14% SWE 11 16 +6% +50% 19 26 0% +94% |
Table 2 Maximum severity of drought as a percentage deficit of mean annual rainfall during 1961-90 for observed (UKMO5K) and modelled (HadRM3H Control) data and percentage future changes predicted under the A2 and B2 scenarios.
|
Region DRO3 DRO6 UKMO Con Fut A2 Fut B2 UKMO Con Fut A2 Fut B2 NS 29 42 +34% +18% 29 35 +50% +49% ES 32 48 +6% +125% 39 89 −15% +22% SS 24 50 −27% −32% 33 50 +29% −33% NEE 32 46 +33% +67% 35 67 +5% +67% NWE 27 39 +75% −20% 28 52 +32% −10% NI 24 44 +31% +13% 23 43 +65% +77% CEE 47 41 +64% +44% 47 60 +14% +46% SEE 42 39 +90% +37% 49 56 +26% +64% SWE 41 32 +20% +56% 46 48 +28% +26% |
In a comparison of the number of drought events from 1961-1990 measured using the observed UKMO5K and modelled HadRM3H Control scenario datasets, it can be seen in Figures 2 and 3 that the over- and underestimation of historical drought event frequency occurs mainly at cells where there are large biases in the observed annual rainfall. This leads to the overestimation of shorter drought events on the east coast, but an underestimation of historical short duration drought in Scotland and the Lake District (Figure 2). For longer duration events, there is significant overestimation throughout the UK, except the southern coastline, and much lower spatial variation than is observed historically (Figure 3).
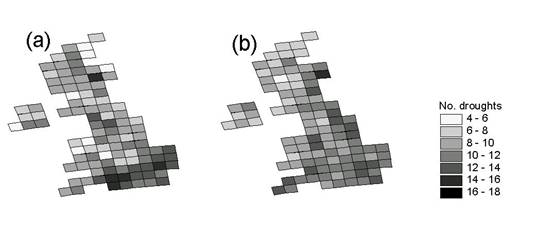
Figure 2 Number of droughts from 3-6 months in duration (DRO3) and with a deficit of more than 10% of annual rainfall in a 30 year period from 1961-1990 using: (a) UKMO5K; and (b) HadRM3H Control scenario data.
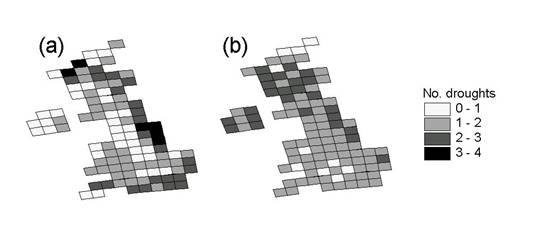
Figure 3 Number of droughts over 6 months in duration (DRO6) and with a deficit of more than 30% of annual rainfall in a 30 year period from 1961-1990 using: (a) UKMO5K; and (b) HadRM3H Control scenario data.
Therefore, for the baseline period from 1961 to 1990, the HadRM3 model overestimates the incidence of drought, particularly in the south and east of the UK, in comparison to observations. This is thought to be the result of an over-dominance of orographic effects in the model which leads to an overestimation of mean rainfall in areas of high elevation, and a corresponding underestimation in areas downwind or in the ‘rain-shadow’. An over-representation of seasonality within the model also means that summer and autumn rainfalls are underestimated in the main, with winter and spring rainfall being overestimated.
(c) Extreme rainfall
Two complementary sets of analyses have been undertaken to assess the performance of the HadRM3H model in the simulation of UK extreme rainfall on an annual basis: regional frequency analysis (RFA) and grid box analysis (GBA). The regional approach allows estimation of the magnitude of long return-period rainfall events with more reliability than single site analyses where only short records are available. The grid box analysis, on the other hand, shows the performance of the RCM at its limited spatial resolution. In both approaches, the analysis was performed using annual maxima of 1-, 2-, 5-, and 10-day rainfall totals. Furthermore, both approaches estimate extreme rainfall using the Generalized Extreme Value distribution fitted using the method of L-moments (Hosking and Wallis, 1997) to define extremes with given return periods.
Despite the original differences in spatial resolution between the modelled and observed data, HadRM3H provides a good representation of extreme rainfall at various return periods and durations across most of the UK. Additionally, the GBA shows that HadRM3H is able to replicate the large observed spatial variation in extreme rainfall found in regions with complex orography, particularly for shorter durations (see Figure 4 for example). However in certain regions, particularly north Scotland, there is a large overestimation of extremes. This is thought to be a direct consequence of the estimation of mean rainfall in these regions by HadRM3H, with the largest model overestimations found along the west coast of Scotland.
Figure 4 Difference in return period estimates (%) between the HadRM3H model and the scaled UKMO (HadRM3H/UKMO) data for the 1-day event (a) 10-year return period and (b) 50-year return period and the 10-day event (c) 10-year return period and (d) 50-year return period.
Similarly, in eastern ‘rain shadowed’ regions there is some underestimation of extremes, highlighted particularly by the GBA. The largest underestimations (30 to 50%) are found in central and east Scotland for 1-day rainfall, increasing to about 80% for 10-day rainfalls.
Significant model underestimation is also found in southern regions of the UK, particularly SEE and SWE. Jones and Reid (2001) attribute this to the lack of model representation of transitory or migratory storm activity from the continent. Here, we attribute this anomaly to the poor representation of convective processes within the model, causing the growth curves to be too flat and underestimating the magnitude of long return period events (see Figure 5).
Figure 5 Comparison of growth curves for southeast England for (a) observed 1961–1990 and, (c) HadRM3H control climate scenario ensemble mean.
References
Hosking, J.R.M. and Wallis, J.R. 1997. Regional frequency analysis: an approach based on L-moments, Cambridge Univ. Press, Cambridge.
Jones, P.D. and Reid, P.A. 2001. Assessing future changes in extreme precipitation over Britain using Regional Climate Model integrations. International Journal of Climatology 21, 1337-1356.