|
Impact of climate change on drought |
Published in:
Fowler, H.J. and Kilsby, C.G. 2004. Future increases in UK water resource drought projected by a regional climate model. Proceedings of the BHS International Conference on Hydrology: Science & Practice for the 21st Century, London, 12-16 July 2004.
See also: assessment of the ability of the HadRM3H model to reproduce the frequency and severity of historic droughts accurately.
This study used two drought severity measures based on cumulative monthly precipitation anomalies in a regional analysis to evaluate the changes in drought occurrence and severity projected by HadRM3H for two different emission scenarios (IPCC SRES A2 and B2, the UKCIP02 medium-high and medium-low scenarios respectively) (IPCC, 2000) for the period from 2070 to 2100. The drought severity indices were calculated using two ‘termination’ rules (Goldsmith et al., 1997). The first is based on a 3-6 month drought, more appropriately describing a surface-water drought. The second describes a 6+ month drought, or a water resource drought likely to additionally affect groundwater resources.
In this study we examined two types of drought event. The first, DRO3, was defined as a 3-6 month short drought having an accumulated deficit exceeding 10% of mean annual rainfall, more likely to affect surface water resources and based upon DSI3. The second, DRO6, is defined as a long drought of 6+ months such as 1975-1976 with an accumulated deficit exceeding 30% of mean annual rainfall, likely to further affect ground water resources and based upon DSI6.
It can be seen in Tables 1 and 2 that both the maximum duration and maximum severity of drought are projected to change under a future climate. Drought duration will increase, in eastern and southern regions, and increases are larger under future scenario B2 than future scenario A2. In Scotland, maximum drought duration is projected to decrease by up to 50% by 2070. In Northern Ireland and southwest England, the changes are also small. However, maximum drought severity is also substantially changed by 2070, with increases of up to 125%. Most regions show an increase in maximum drought severity, although these increases are lower in northern and western regions. This suggests that drought onset may be more rapid and that although droughts may be shorter, that water deficits may be larger.
Table 1 Maximum duration of drought in months during 1961-90 for observed (UKMO5K) and modelled (HadRM3H Control) data and percentage future changes predicted under the A2 and B2 scenarios.
|
Region DRO3 DRO6 UKMO Con Fut A2 Fut B2 UKMO Con Fut A2 Fut B2 NS 13 26 −38% +64% 26 29 −3% +32% ES 10 20 0% +90% 17 54 −48% +26% SS 15 21 −38% −11% 17 29 0% −36% NEE 11 17 +29% +38% 17 31 +6% +40% NWE 12 19 +53% 0% 20 25 +16% +55% NI 14 19 −5% +25% 16 27 +11% +129% CEE 15 15 +27% +40% 16 31 −26% +150% SEE 12 15 +20% +67% 14 27 −4% +14% SWE 11 16 +6% +50% 19 26 0% +94% |
Table 2 Maximum severity of drought as a percentage deficit of mean annual rainfall during 1961-90 for observed (UKMO5K) and modelled (HadRM3H Control) data and percentage future changes predicted under the A2 and B2 scenarios.
|
Region DRO3 DRO6 UKMO Con Fut A2 Fut B2 UKMO Con Fut A2 Fut B2 NS 29 42 +34% +18% 29 35 +50% +49% ES 32 48 +6% +125% 39 89 −15% +22% SS 24 50 −27% −32% 33 50 +29% −33% NEE 32 46 +33% +67% 35 67 +5% +67% NWE 27 39 +75% −20% 28 52 +32% −10% NI 24 44 +31% +13% 23 43 +65% +77% CEE 47 41 +64% +44% 47 60 +14% +46% SEE 42 39 +90% +37% 49 56 +26% +64% SWE 41 32 +20% +56% 46 48 +28% +26% |
Figures 1 and 2 show the increase in number of DRO3 and DRO6 drought events projected by 2070 for the A2 and B2 emissions scenarios. It can be seen that shorter duration droughts are predicted to increase in frequency under the A2 scenario, across almost all of the UK, excepting northern Scotland and some eastern coastal areas. In the B2, scenario, there is an increased frequency of short duration droughts in northern regions but a decrease elsewhere. This is slightly misleading however, and results from a large increase in drought duration in this future scenario. These droughts are then counted as longer duration, DRO6, drought events and this leads to the relative decrease in the shorter duration events.
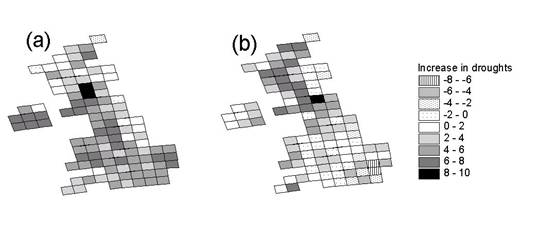
Figure 1 Increase in number of drought events from 3-6 months in duration (DRO3) with a deficit of more than 10% of annual rainfall during the period 2070-2100 when compared to 1961-1990 for: (a) HadRM3H Future scenario A2; and (b) HadRM3H Future scenario B2.
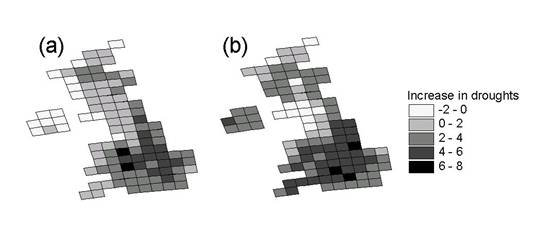
Figure 6 Increase in number of drought events over 6 months in duration (DRO6) with a deficit of more than 30% of annual rainfall during the period 2070-2100 when compared to 1961-1990 for: (a) HadRM3H Future scenario A2; and (b) HadRM3H Future scenario B2.
In terms of longer drought events, both the A2 and B2 scenarios show a similar pattern of change by 2070. The largest increases are in the southern and eastern regions and the number of drought events during a 30 year period triples in some southern regions when compared to the control scenario. Interestingly, the B2 scenario provides a larger increase in number of drought events than the more ‘severe’ A2 scenario in most regions. This is thought to be a result of the large increase in winter rainfall throughout the UK that is seen in the A2 scenario. This increase is much smaller in the B2 scenario and combined with large summer and autumn reductions in both scenarios causes the duration and occurrence of drought to increase more under the B2 scenario, but the increase in drought severity to be greater under the A2 scenario.
Table 3 gives the projected change in frequency of drought events for the 9 regions. It can be seen that again, for short duration droughts, there is a decrease in frequency under the B2 scenario in southern and eastern UK, but increases in the frequency of longer duration droughts in most regions except for Scotland. The A2 scenario is more severe in terms of regional drought. Short term drought events are projected to increase in frequency by at least 35% in all regions except northern Scotland, with a maximum increase of 118% in southern Scotland. For the longer duration events, the changes are less severe in general but nonetheless highly significant for future water resources management throughout the UK.
Table 3 Number of drought events during 1961-90 for observed (UKMO5K) and modelled (HadRM3H Control) data and percentage future changes predicted under the A2 and B2 scenarios, for a DR03 drought with more than 10% deficit and DRO6 droughts with more than 30% deficit.
|
Region DRO3 DRO6 UKMO Con Fut A2 Fut B2 UKMO Con Fut A2 Fut B2 NS 8 7 +1% +50% 8 8 −23% 0 ES 9 7 +35% −40% 7 8 +58% −25% SS 6 7 +118% −10% 7 9 −11% +10% NEE 9 10 +50% 0% 8 8 +79% +114% NWE 7 8 +92% +11% 7 8 +23% +30% NI 9 8 +85% +25% 7 8 +72% +10% CEE 10 10 +45% 0% 7 9 +66% +40% SEE 14 11 +50% −29% 6 10 +42% +8% SWE 11 10 +50% −14% 9 10 +23% 0% |
References
Goldsmith, H., Mawdsley, J., and Homann, S., 1997. Drought, climate change and water resources in north east England. BHS 6th National Hydrology Symposium, Salford, 1997, p13-22.
IPCC. 2000. Technical Summary, In: Nakicenovic, N. and Sawrt, B (Eds). Special Report on Emissions Scenarios. Cambridge University Press, Cambridge, 570 pp.