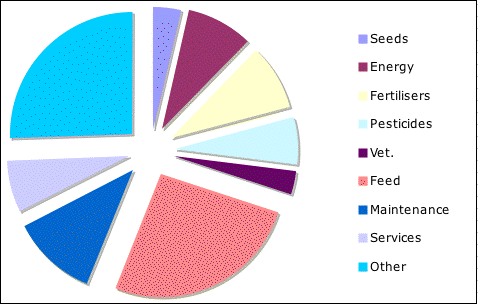
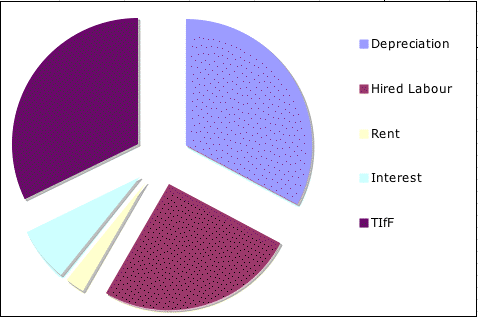
Where Total Income from Farming (TIfF) is the remaining income after
all other actual costs have been met to provide a return to the owners
and operators of the British farm (32% of GVA, or 15% of revenues).
3. Recent History of British Agriculture
The development of agricultural earnings - 1973 - 2006 (Part 1 -
current terms)
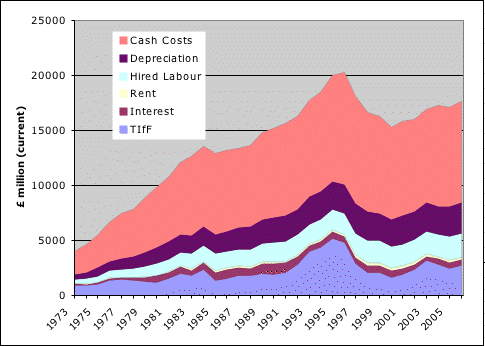
So, plenty of growth here, then, with
some considerable inter-year variations? What are we
missing? What do we mean by 'current'?
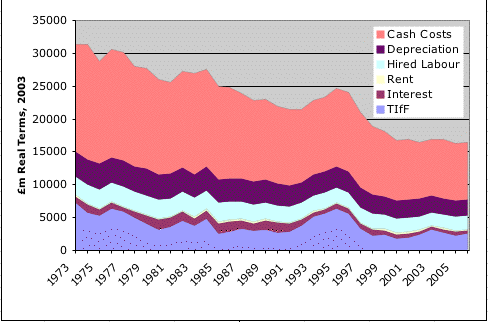
Development of British Agriculture - Part 2, in
Real
Terms (using the GDP deflator, basis 2003):
[Note: GDP Deflator: from
National
Income Statistics, -and, for the latest figures, see
here.
Question:
what are the
explanations for this decline in real agricultural activity (in
purchasing power terms)?
Answers:
- As any economy grows richer, so it spends a smaller fraction of
total income on food (income elasticities for food generally
substantially less than 1);
- As a consequence, the fraction of national income accruing to the
food industry declines;
- The economic signals of this decline are falling relative (real)
prices of food, and falling real incomes in farming;
- Fewer people can earn a full time living from farming, including
those who are trying to sell inputs to farmers
- The agricultural sector declines in real purchasing power terms,
as people find other things to do.
Question:
Can't Policy Make a Difference?
To answer this question, we need
a longer term history:
British
Agriculture's Real Gross Product, 1947 - 2006
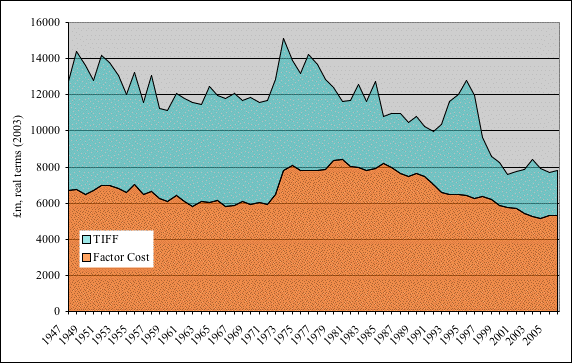
Going back to 1947, when the UK government introduced the 1947
Agricultural Act, which guaranteed prices for farm commodities, and
made up the difference between these guaranteed prices and market
prices with deficiency payments, and then looking at the apparent
consequences of Britain's entry to the European Community in 1973,
where the UK adopted the CAP (or at least began to acceed to the CAP),
it looks as though policy [change] did make a considerable difference,
at least to begin with.
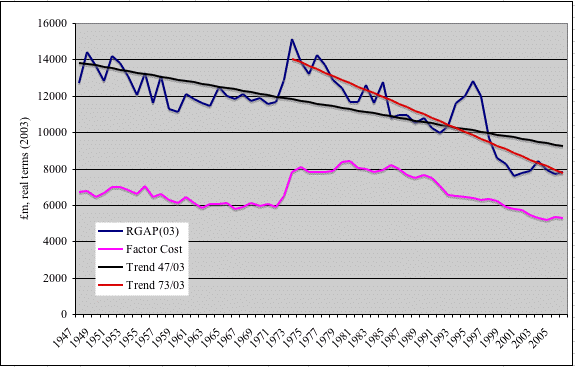
But, is the longer term trend decline in Ag. Gross Product more
reliable than the shorter term ('CAP') trend?
Question:
What happened in 1973 - and can we learn anything from it? - like what
happend in 1995?
Back to Index
