Externalities
Externalities arise when the activity of one
person, household or firm causes a loss or a gain to another, and where
these losses or gains are uncompensated or unrewarded. If the
gain
or loss effects are comensated or rewarded, then we have a normal
market
transaction - externalities are those effects which are outside
(external
to) the market mechanisms of payments and contracts.
A typical example is pollution of air, water or
soil,
were the pollution is the unintended by-product of production which
affects
the value of the resource to other users or enjoyers, but which is not
accounted for in the markets for either the production inputs and
factors,
or the markets for the products of the production process. Other
relevant
examples are pretty countrysides and wildlife, which are largely a
consequence
of farming practices in the UK, either producing these "by-products" or
not, depending on the practices adopted.
These external effects are important because they
mean that market transactions do not account for all the
benefits
and costs of particular activities, so the outcome of markets cannot
ensure
a social optimum. They arise because of two major factors:
-
first, transactions costs - the
necessary transactions
to account for the benefits and costs (to internalise the effect within
a market mechanism) are difficult and expensive in time and effort;
-
second, because the property rights to
pretty
countrysides or wildlife are unclear or contested - who owns the
landscape
or view, or the wildlife? Without clear ownership rights, there is no
legitimate
basis for the negotiations about rewarding benefits or compensating
losses.
Take as an example the case of pollution of a river
by some production system (a dairy farm, if you like). If the farmer
can
produce without regard to the pollution he causes, he will maximise his
private profits, since pollution control will generally cost money and
reduce margins. There is, then, some upper bound to the level of
pollution
that this production activity will cause, consequent on the private
profit
maximising behaviour of the dairy farm. However, this level of
pollution
may well kill all the wildlife in the river, through atrophication.
This
damage will affect anglers, wildlife enthusiasts, water users
downstream,
ramblers etc., who value cleaner rivers and the benefits they enjoy
from
cleaner rivers.
We can picture the situation as in the following
diagram.
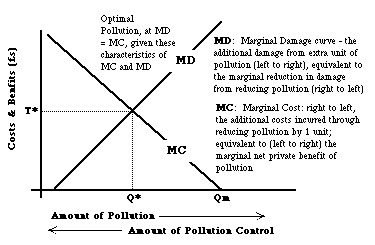 The
point of private profit maximisation is Qm. At this point (and
corrpsonding
production activity), the damage suffered by the river users and
enjoyers
is very substantial. On the other hand, there is a level of production
and associated production practice which would eliminate the pollution
entirely (shown by the intersection of the MD curve with the horizontal
axis - implying in this illustration that some level and form of dairy
farming is actually beneficial to the river environment).
The
point of private profit maximisation is Qm. At this point (and
corrpsonding
production activity), the damage suffered by the river users and
enjoyers
is very substantial. On the other hand, there is a level of production
and associated production practice which would eliminate the pollution
entirely (shown by the intersection of the MD curve with the horizontal
axis - implying in this illustration that some level and form of dairy
farming is actually beneficial to the river environment).
Suppose that the farmer owns the river, and is alive to the business
opportunities of the river. It might be worth his while to find out how
much people were prepared to pay for enjoying or using the river. The
answer
would be that they would only be prepared to pay for a cleaner and less
polluted river. The marginal damage (MD) curve shows how much
they
would be prepared to pay for a cleaner river, reading this curve from
right
to left, since it shows the monetary equivalent of the damage they
suffer
from the polluted river. They would be prepared to pay up to this
damage
suffered to avoid it (prefering to pay less of course). The sensible
farmer
would then negotiate with the potential users, agreeing to take steps
to
reduce pollution so long as the price paid for a cleaner river were
greater
than the reduction of net revenue earned from the farming operation as
a result of reducing pollution. This reduction is shown by the MC curve,
again reading from right to left. The final agreement between farmer
and
user would be at Q* pollution, with a payment of T* per
uint
of cleaner river by the users to the farmer.
What if the farmer does not own the river? Suppose the river is
owned
by someone else, who is also concerned about its value to them and
other
users. In this case, these owners can require the farmer to take steps
not to damage their resource, and to pay compensation to the owners if
such damage occured. The compensation required by the owners is shown,
again, by the MD curve (reading from left to right) - a little
compensation
for a small amount of pollution and a lot for a large amount. What
would
now be the farmer's best option? Think, before you read on.
The farmer increases his private net revenues the more pollution he
causes, but at a reducing rate, as shown by the MC curve, left to
right.
But he is now required to pay for this pollution at an increasing rate,
according to the MD curve, left to right. The profit maximising optimum
for the farmer is now where the reducing marginal benefit of polluting
(the MC curve) crosses the increasing marginal cost to him of polluting
- the MD curve. Once again, the market equilibrium solution (the
optimum)
is at pollution level Q* and the farmer paying T* per unit of pollution
to the owners for the priviledge of polluting the river.
Conclusions on externalities
Thus, according to these principles, there does exist a logic which
would allow for negotiations between owners and beneficiaries of a
resource
and polluters or damagers of (in effect using up) this resource to
agree
on an appropriate transaction and contract which balances the interests
of the producers and users - allowing some pollution, but preventing
levels
of pollution where the gain from additional pollution is less than the
cost of this additional pollution. In effect, our marginal damage
curve
above is the marginal social cost of pollution, while the
marginal
cost curve is the marginal social benefit of pollution.
This last remark might raise some eyebrows. The marginal net benefit
of private production, however, is also a social benefit (reflecting
the
market demands for the product in question, milk and beef in this
case).
Of course, we can object that these markets are distorted by government
policies and intervention, and thus do not properly reflect the social
benefit of dairy farming. Quite right. The analysis above assumes that
the markets for the products produced with pollution are perfectly
competitive
and not distorted.
The analysis also points up the often very serious difficulties with
externalities. Three of the most important are as follows.
-
First, it is often very difficult to estimate the monetary
equivalent
of the damage caused by pollution (or equivalently, the value of
cleaner
environments - more diverse wildlife and and more valuable landscapes
etc.).
Voluntary donations to organisations such as the RSPB strongly suggest
that there is a large demand amongst at least some of the general
public
for cleaner and more natural environments. It might be that, in
particular
circumstances, the MD curve in the above diagram lies everywhere above
the MC curve, in which case the market (economic) optimum level of
pollution
would be zero (that level of production which does not damage the
environment
at all). In other cases, however, it could be that the actual
willingness
to pay exhibited by the general public for cleaner environments is
simply
insufficient to outweigh the indirect benefits of pollution (the value
of the production and associated consumption). A case in point is
traffic
pollution - generally, the public is concerned to reduce this, but is
not
prepared to do without all the indirect benefits of traffic pollution.
So we try to insist that research and development is devoted to making
our "necessary" traffic cleaner, and penalising only those who cause
excessive
pollution, rather than everyone.
-
Second, there are often very considerable transaction and
negotiation
costs associated with getting everyone concerned with the problem
together
and reconciling their differences. Frequently this is because the
externality
has at least some of the properties of being also a public good (see below) - like
better environments, cleaner air and rivers etc. But, even where this
is
not the case, the fact that the side-effect has not already
been
accounted for in market transactions and remains an externality itself
implies that the costs and effort required to undertake the necessary
transactions
are too great to be worthwhile. Externalities are, therefore, an
indication
that the transactions necessary to internalise them are more costly
than
the benefits which might be obtained from carrying out the
transactions.
The existence of organisations like the RSPB illustrate the market
response
- try and develop institutions and organisations to reduce the
transactions
costs and negotiate collective agreements to reduce negative (bad)
externalities
and encourage positive (good) externalities.
-
Third, the ownership of the property rights on the natural
resource
is often contested. Who should pay for pollution depends on who owns
the
affected resource or property, as shown above. The notion that farmers
should be subsidised (paid) to avoid polluting the natural environment
implies that farmers own the natural environment. If they do not, then
the implication is that farmers should be taxed (required to pay
compensation)
for any pollution they cause. The general presumption (outside
agriculture)
is that air, water, and even soil are common property - belonging to
everyone
- so the polluter pays principle applies. Should farmers be
different,
and if so, why? Thoughtfull and well argued Answers
to me, please!
It is partly because of these difficulties, and also because the
effects of pollution (or, more generally, environmental degradation)
tend
to be
specific to particular locations and different between different
locations and practices (that is, the effects are highly
heterogeneous),
that governments are asked (by their electorates, assisted by pressure
groups) to intervene and find solutions to the externality problems.
This
analysis suggests that the appropriate solution is a system of
pollution
taxes or subsidies to avoid degradation. It can be shown that, under
restrictive
conditions, the tax/subsidy system is more efficient than
regulation
- blanket restrictions on levels of pollution and fines/penalties for
contravention
of the regulations (see here
for a demonstration of this conclusion, and reasons why regulation
might, nevertheless, be a preferable option in many cases, as is
frequently
observed in public opinion preferring regulation to taxes and
subsidies).
Return to AES829
notes