A computer generated model for assessment of lesion edge
sharpness in breast MRI
This is a poster presented at IOS 2000
(British Journal of Radiology Supplement to volume 73 poster 0207)
INTRODUCTION
In breast MRI, small enhancing foci may be difficult to characterise
as either benign or malignant using enhancement characteristics
alone. Morphological features, including edge sharpness, may be useful
in such cases. Edge sharpness, however, may be difficult to assess,
either by qualitative observation, or by automated methods. This may
be a particular problem in dealing with small lesions (< 5 mm) which
could have a diameter of 5 pixels or less. Pixels located at the edge
of a lesion contain little fine detail, and may include signal from
both lesion and adjacent tissues (partial volume effect).
In order to assess perception of edge sharpness (by observers, or
using quantitative computational methods) it would be helpful to be
able to control the appearance of the lesion. The purpose of this
study was to develop computer generated images of simulated lesions,
which could then be utilised to assess perception of edge sharpness
for a range of lesion and pixel sizes.
METHOD
The source data was acquired from patients undergoing breast MRI using
a T1 weighted 3D FLASH (Fast Low Angle Shot) acquisition at 1.0 T
(Siemens Impact Expert). In routine clinical practice, images are
acquired immediately before and before and after injection of Gd DTPA
(0.2 mmol/kg). A subtracted image set can be created by subtracting
the post from pre contrast image.
|
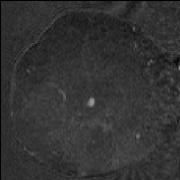
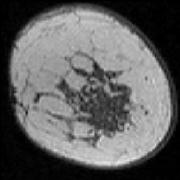
Figure 1a Coronal plane section of the right breast, from subtracted
dataset showing a well defined enhancing lesion The mass was shown to
be a fibroadenoma
|
|
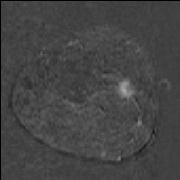
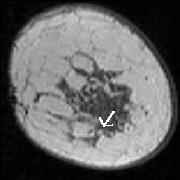
Figure 1b Coronal plane section from a subtracted dataset showing an
enhancing lesion within the lateral aspect of the left breast
subsequently shown to be a carcinoma
|
To generate simulated lesions, we start with a 3D array of voxels
which are much smaller than those on the desired image. The voxels
which lie inside an ellipsoid (a 3D ellipse) are identified (Figure
2).
For each voxel inside the ellipsoid, the distance to the nearest edge
of the ellipsoid is calculated. The voxel is assigned a intensity
value which depends on this distance - to simulate a blurred edge, the
intensity linearly decreases to zero at the edge of the ellipsoid. The
number of voxels over which this decrease occurs determines the
sharpness of the edge.
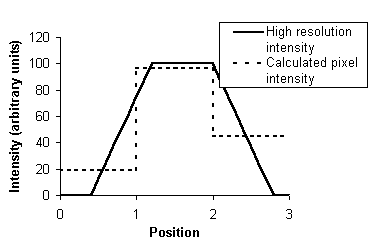
The pixel intensity on the simulated image is then calculated by
averaging the voxel intensity in the 3D array in the x, y and through
slice (z) directions.
|
Figure 3 Plots of intensity along one axis of the ellipsoid. The solid
line represents the intensity in the high resolution voxels, and the
dashed line the averaged intensity in the generated image pixels.
|
Random Gaussian noise is then added to the images to simulate the
appearance of MR images. The standard deviation of the noise is varied
according to the image parameters such as pixel size.
RESULTS
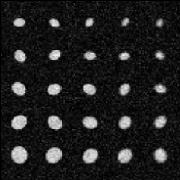
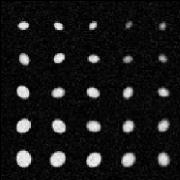
Fig 4 shows two generated images of ellipsoids of different sizes and
edge sharpness. 4b) has an improved SNR, but slightly more blurred
edges due to partial volume effects associated with its larger slice
thickness.
| 
|
| Figure 4a) slice thickness 1 mm.
| 4b) slice thickness 4mm.
|
The images have a 1mm2 pixel size, ellipsoid radii varying from 3.5 to
6 mm. The distance over which the intensity in the ellipsoid falls
from its maximum to zero at its edge varies from from 0 to 2.5 pixels.
An array of simulated images can be generated, changing such
parameters as the size, shape and intensity profile of the lesion, the
signal to noise ratio, and the pixel size/slice thickness. These can
then be used to test perception of edge sharpness under the varying
conditions.
The simulations can also be combined with real images. which allows
the edge sharpness to be assessed under realistic conditions.
| 
| 
|
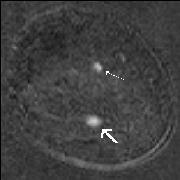
| Figure 5a) Coronal plane pre contrast image of left breast.
| 5b) post contrast image with added simulated lesion
| 5c) image generated by subtracting 5b) from 5a).
|
The simulated lesion is indicated by the thick arrow. The thin arrow
points to a real area of enhancement (subsequently found to be a
fibroadenoma)
More complex simulations
Using more complex mathematical descriptions of shape, such as b-spine
curves, it is possible to simulate lesions with irregular
boundaries. The intensity profile may also include a fall off in
signal intensity towards the centre of the lesion, as seen in some
malignant lesions.
|
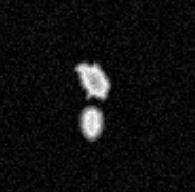
Figure 6 Two simulated lesions with an irregular surface, and radial intensity
profile which decreases centrally
|
These simulated lesions can then be inserted into real MR images to
generate image sets which may be used to train observers.
CONCLUSION
This simulation enabled the generation of images of 'lesions'
representative of breast MR lesions, with varying edge
sharpness. These virtual lesions may be inserted into real imaging
datasets from breast MRI examinations.
In future, the simulation will be used to explore the relationship
between lesion size, spatial resolution, lesion edge parameters and
perception of lesion edge by observers.
Comments to : m(dot)j(dot)firbank(at)ncl(dot)ac(dot)uk Last modified : 5 June
2000