
Hay and Aftermath Yield
The grass is cut each year, usually at the end of June, and hay is made on the plots. Samples are taken for dry matter determination and the yield calculated; this is currently based on 4 samples per plot, each of 10 m2. The yield changed very abruptly upon the commencement of treatment differences in 1896 (Figure 1) and although there are trends in the long-term yield which differ between treatments, the relative order of treatments has remained constant throughout. Note the instantaneous effect of manure and complete fertiliser, which increased yield by about 50% in the first year of treatment, while the phophate-only fertiliser increased yield by only 9%. The cumulative effect of the manure become clear with it quickly giving a larger yield than the compound fertiliser as nitrogen residues accumulate in the soil
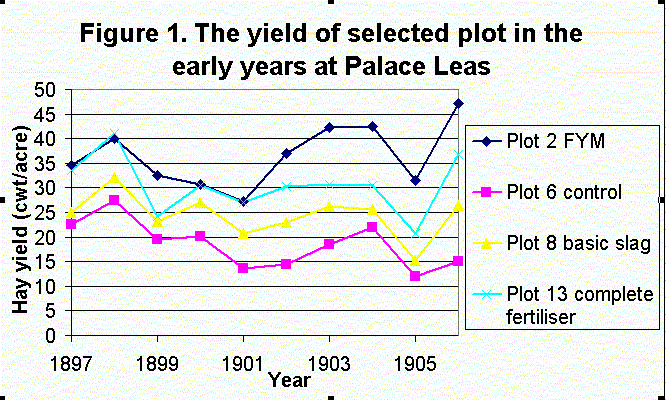
There is clearly a very large variation in yield from year to year. The hay yield is closely related to the input of nitrogen, and as a result the farmyard manure plots have consistently given the best yields (table 1). Note the downward trend in the yield on the unmanured control in Figure 1- the whole field had probably received manure intermittently in the years before the experiment began and the effect of this was becoming exhausted.
Table 1. The effect of manurial treatment on hay yield (average of 1897-1984).
|
Plot
|
Hay yield kg ha-1
|
SD
|
CV %
|
|
1
|
6496
|
2063
|
32
|
|
2
|
5920
|
1714
|
29
|
|
3
|
5142
|
1419
|
28
|
|
4
|
4824
|
1558
|
32
|
|
5
|
5120
|
1584
|
31
|
|
6
|
2554
|
1072
|
42
|
|
7
|
3049
|
1179
|
39
|
|
8
|
3463
|
1014
|
29
|
|
9
|
2317
|
1028
|
44
|
|
10
|
4113
|
1331
|
32
|
|
11
|
2928
|
1231
|
42
|
|
12
|
3873
|
1287
|
33
|
|
13
|
4415
|
1271
|
29
|
The yields can be seen to fall into three groups - farmyard manure plots 1-5 plus plot 13, which have a large yield, plots 8, 10 and 12, which have a moderate yield and plots 6, 7, 9 and 11, which have low yield. Plot 13 receives all three major plant nutrients while plots 8, 10 and 12 only receive phosphorus plus nitrogen (plot 12) or potassium (plot 10); clearly the lack of balance in nutrients is reducing the yield of these plots. None of the low yielding plots receive phosphorus and this can be seen as a major limitation to growth - even the same amount of nitrogen as plot 13 but without phosphorus clearly has a severe constraint on yield. This discovery led to Gilchrist's promotion of basic slag (Pawson, 1960) as the key fertiliser to improving grassland - he linked the effect of the phosphorus to the increase in nitrogen fixation by clovers; basic slag also raised the pH of more-acid soils.
It is also salutary to note the large variability of yield from year to year (measured as the coefficient of variation (CV%)) which is inversely related to the yield - this is dealt with more fully in the section on the effect of weather variation on yield.
![]()
There have been few measurements of the aftermath growth
(based on the use of exclosure cages), but where these are available (Shiel
& Batten, 1988) they show that the farmyard manure treatment produced
the greatest regrowth and that the stock were very selective as to which
herbage they ate (table 2). The species-rich plots,
which are fertilised with phosphorus, are grazed more efficiently than
any others.
Table 2. Aftermath regrowth and consumption by stock
| Plot | Growth t ha-1 |
Grazed t ha-1 |
Ungrazed t ha-1 |
Proportion of regrowth eaten % |
| 2 | 2.91 | 2.22 | 0.69 | 77 |
| 6 | 1.94 | 1.23 | 0.71 | 65 |
| 7 | 2.14 | 1.06 | 1.08 | 32 |
| 8 | 2.56 | 2.06 | 0.5 | 78 |
| 10 | 2.19 | 1.43 | 0.76 | 61 |
| 13 | 2.32 | 1.53 | 0.79 | 67 |
![]()
All material © Robert Shiel 2000
Page last updated: